
Introduction
Light microscopy techniques have been vital to our understanding of biological structures and systems since their invention in the late 16th century. However, conventional light microscopy techniques are limited by the diffraction limit of light, preventing us from seeing anything smaller than approximately 200 nm in x and y and approximately 500 nm in z. Many molecules and structures of interest require a higher degree of resolution than this to visualize, so it became necessary to develop techniques to break the diffraction limit in order to resolve below 200 nm. These techniques are collectively referred to as ‘super-resolution‘ techniques.
Super-Resolution Lozalization
One such family of techniques is the super-resolution localization microscopy techniques which comprise Photoactivated Localization Microscopy (PALM), Stochastic Optical Resolution Microscopy (STORM) and DNA-based Point Accumulation for Imaging in Nanoscale Topography (DNA-PAINT). These techniques are able to temporally isolate single fluorophores from a group and take advantage of the ability to localize these fluorophores to sub-diffraction-limited spots. By individually localizing single fluorophores and reconstructing them into one image, we are able to generate a super-resolved image that effectively breaks the diffraction limit.
The Diffraction Limit Of Light
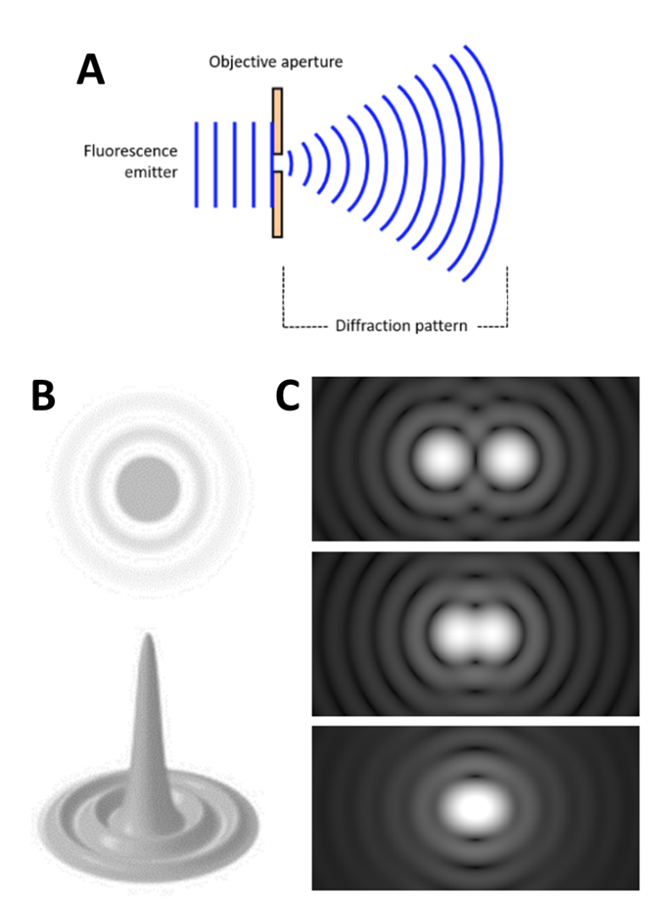
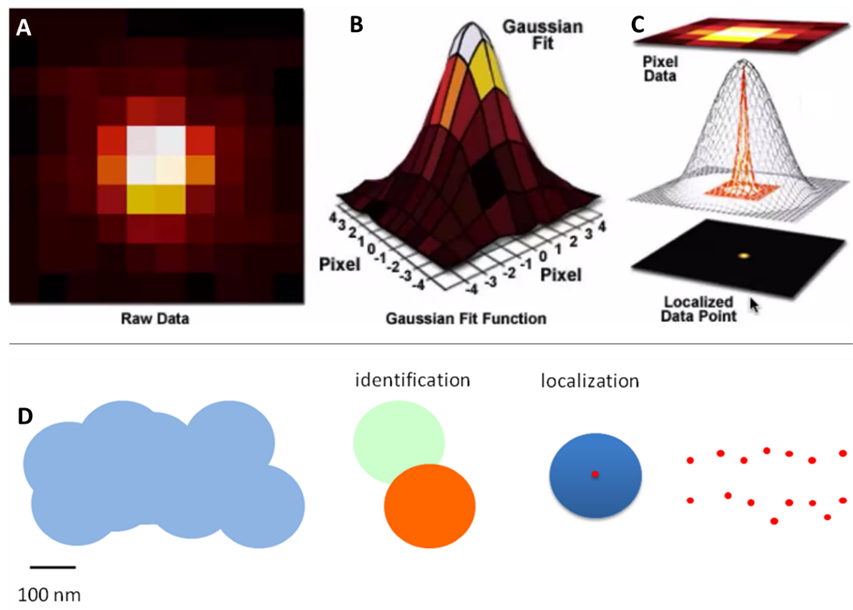
Light travels as a wave, so when it is focused to a small spot with a lens, no matter how good the objective lens is, the focal spot will have a larger size than the actual fluorophore. This happens because the wavefront of the fluorescence emission becomes diffracted at the edges of the objective aperture. This effectively spreads the wavefront out, widening the fluorescence emission into a diffraction pattern which has a central spot larger than the original fluorophore, as seen in Fig.1.
The size of this diffraction-limited central spot is approx. half the size of the wavelength of the emitted light, the full equation was determined by Ernst Abbe in 1873 as reads as follows:
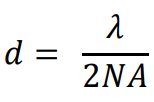
Where d is the size of the diffraction-limited spot, λ is the wavelength of emitted light and NA is the numerical aperture of the objective.
If we were to image GFP (this fluorophore emits light at ~510 nm) with a high NA lens (1.4) the size of the fluorophore reported by the microscope would be 182 nm. This is much larger than the actual fluorophore which may be just 2 nm. This is the diffraction limit of light. This central spot is far larger than the actual fluorophore and takes the shape of an Airy disk.
Airy Disks
The diffraction-limited spot takes the shape of an Airy disk, named after mathematician George Biddell Airy. It consists of a bright central spot with a series of concentric diffraction rings surrounding it (Fig.1)
A fluorophore displaying a single Airy disk can be localized more precisely by statistically fitting the central spot to a Gaussian function. As the center spot is the brightest and most localized to the true location of the fluorophore, fitting a spot to the center of the disk allows for more accurate localization. This results in the 3D representation of the Airy disk, where the height relates to the intensity of the emitted light, as seen in Fig.1. The higher and thinner the center peak, the more accurately the fluorophore can be localized: by collecting more photons, the fluorophore can be localized with even greater precision. In this way, fluorophores have been localized to below 10 nm accuracy.
The Rayleigh Criterion
However, there is the issue of the Rayleigh limit, highlighted in Fig.1C: if two Airy disks are too close together they can merge into one, making it impossible to differentiate close objects apart. These merged disks would be fitted to a single data point and information is lost. Microscope samples contain millions of molecules that can be various distances apart, if they are too close they will be observed as a single point instead of multiple points.
In 1896, Lord Rayleigh refined the Abbe equation to account for how far apart two fluorophores need to be in order to differentiate them:
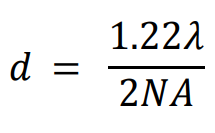
Using the GFP calculation from earlier, the distance required to differentiate two GFP fluorophores with the 1.4 NA objective would be 222 nm. This situation is not always possible, as sub-cellular components such as membrane proteins, transport proteins, and ribosomes are easily below 50 nm. It would be impossible to directly image a group of these molecules because they would not typically be spaced far enough apart to individually localize every one, and data points would be merged together. Only with super-resolution techniques can these samples be properly imaged.
Super-Resolution Localization
Super-resolution localization microscopy techniques get around the limitation of merging Airy disks by selectively switching fluorophores on and off between frames of an image. In this way, an individual fluorophore can be turned on, localized and turned off, then a different fluorophore can be turned on, localized and turned off. By continuing in this fashion every fluorophore can be localized, albeit with enough image frames. This process of localization is outlined in Fig.2.
Sub-Pixel Localization
Localizing fluorophores to sub-diffraction-limited spots on a pixel can be a difficult concept to follow as the size of the pixel is conventionally considered to be the smallest area that can contain an image.
For super-resolution localization microscopy, the pixel size is usually magnified to approximately 100 nm to reach Nyquist sampling. A fluorophore can then be localized to a sub-pixel resolved location of under 10 nm, allowing multiple fluorophores to be visualized on a single pixel.
This is typically achieved through Gaussian fitting, as seen in Fig.3. As seen in this figure, a diffraction-limited spot extends approximately 200 nm in diameter over the fluorophore and covers all pixels in a 3×3 area. The Gaussian fit works by judging the intensity of the neighboring pixels to localize the fluorophore to the central pixel.
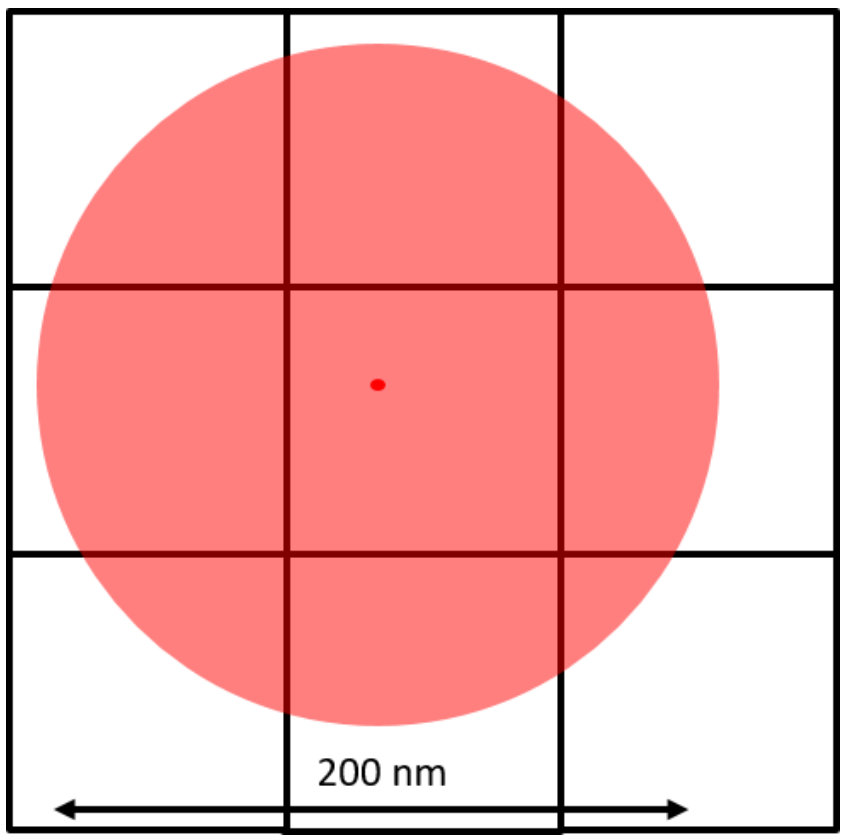
The brightest pixel is the central pixel because this is where the fluorophore is located. The pixel to the left of the central pixel has a higher intensity than the pixel to the right of the central pixel so the peak must be on the left side of the central pixel. The pixel above the central pixel has a higher intensity than the pixel below the central pixel so the peak must be at the top of the central pixel. By then taking in the information from the corner pixels the Gaussian fit can accurately localize the fluorophore to a sub-pixel location. The brighter the fluorophore and the more photons collected, the better the localization accuracy.
Super-Resolution Localization Techniques
All super-resolution localization microscopy techniques share the common methodology of creating a super-resolution image by individually localizing single fluorophores while separating them temporally. The way they differ is in the methods they use to switch the fluorophores on and off.
Photoactivated Localization Microscopy (PALM)
PALM was first published by Eric Betzig and Harald Hess in 2006 using photoactivatable fluorescent proteins bound to molecules of interest, in order to compare PALM to transmission electron microscopy (TEM) and total internal reflection fluorescence microscopy (TIRF).
The key feature of photoactivatable fluorescent proteins is that they exhibit no fluorescence until stimulated by certain wavelengths of light. So initially, all photo-activatable fluorescent proteins in the specimen are inactive. A laser of an appropriate wavelength is used to photoactivate a small subset of the fluorescent proteins, controlled by using a sufficiently weak laser intensity. The fluorescent proteins are activated randomly but the probability of activation is proportional to the intensity of the activation laser.
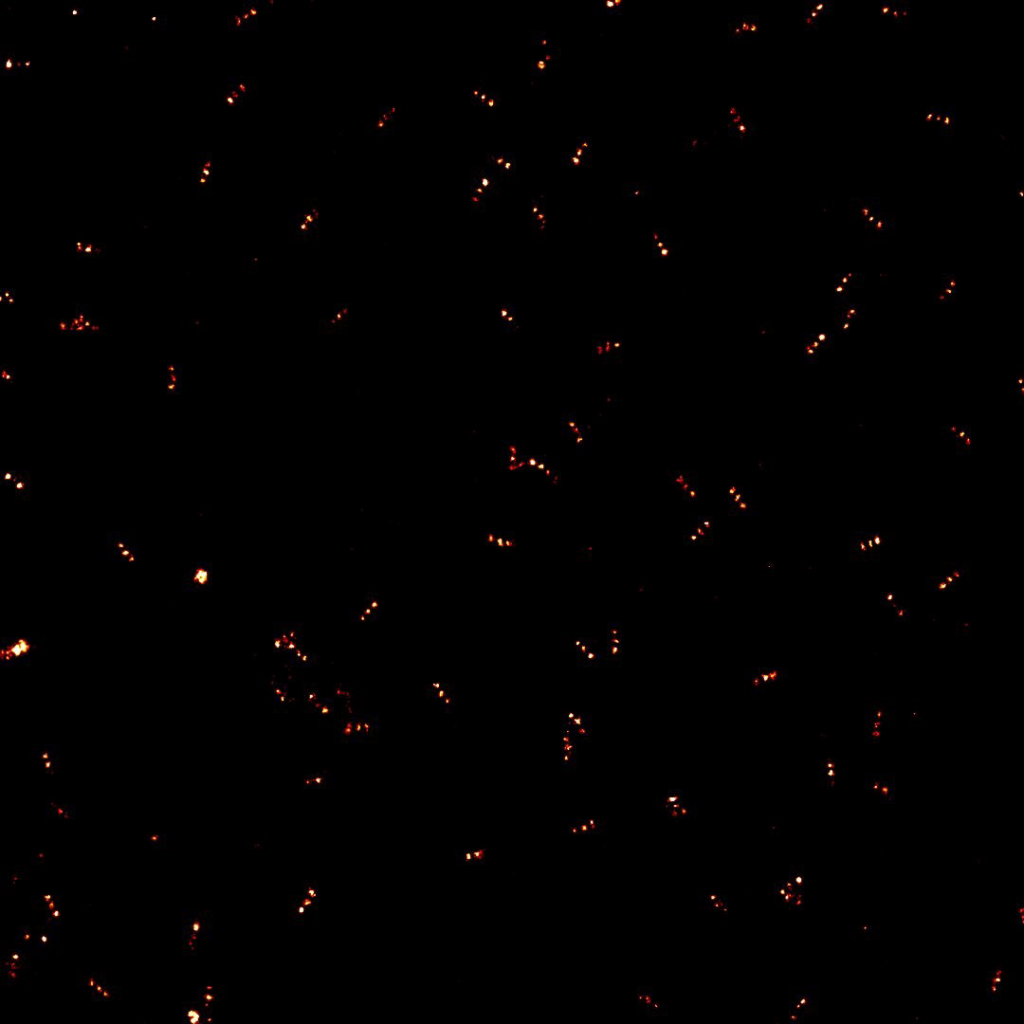
Following activation, a readout laser of a longer wavelength is used to excite the photoactivated fluorescent proteins and detect their positions. The subset of fluorescent proteins activated by the activation laser is low enough that the proteins are far enough apart to be individually localized. This frame of data is saved and the fluorescent proteins are left to photobleach until no photoactivated fluorescent proteins remain. The activation laser is then applied again to activate another subset of fluorescent proteins and the method is repeated. This continues until all molecules in the specimen have been localized and none remain to be activated. The raw data, consisting of thousands of individual frames, are reconstructed into a single image displaying every localized fluorescent protein to produce the final image, such as the example seen in Fig.4.

Stochastic Optical Resolution Microscopy (STORM)
STORM was first published by Xiaowei Zhuang in 2006 using synthetic, photo-switchable fluorescent dyes bound to molecules of interest instead of photoactivated fluorescent proteins. Although Zhuang initially used the Cy dyes, Cy3 and Cy5, by far the most popular dye for STORM now is AlexaFluor 647.
The principle behind STORM is essentially the same as PALM but STORM dyes do not need to be activated and bleached, instead, they blink when subjected to strong laser power.
STORM takes advantage of keeping the dye molecules in the ‘dark state’. Typically, fluorescent dyes will be excited, enter the emission state and then the dark state where they will bind to free oxygen species to enter the bleached state. In the bleached state, the dye will not fluoresce again but by depriving the dye of free oxygen species, the dye will be prevented from entering the bleached state. By keeping the dye in the dark state, strong laser power may cause it to enter the emission state again. This constant movement from the dark state to the emission state gives the impression that the dye is blinking.
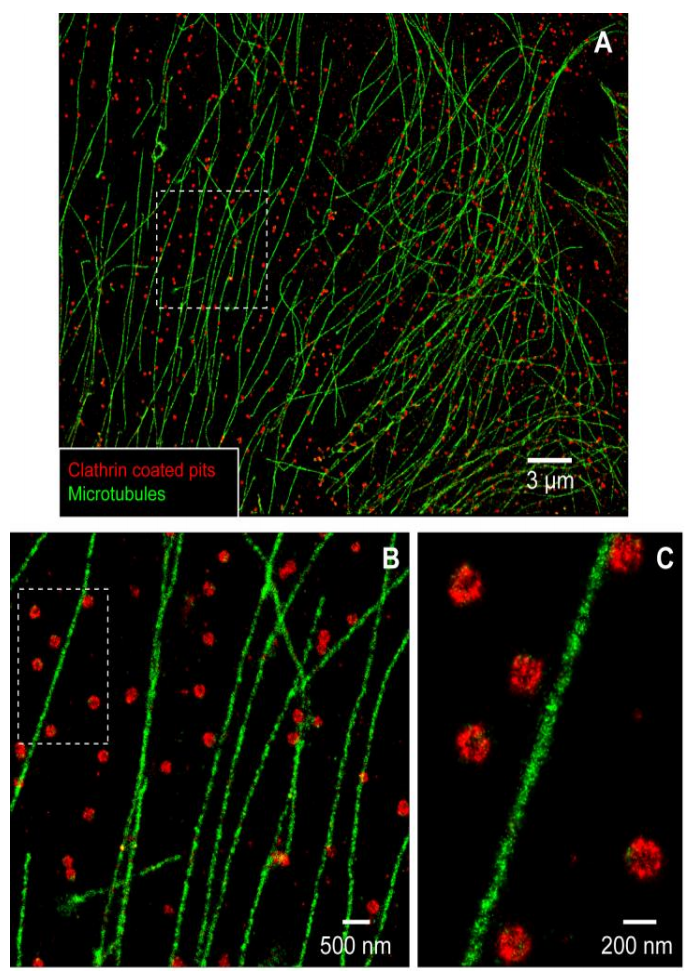
An important fact about STORM is that the fluorophore blinking is random, so for each frame of an acquisition, a different subset of dye molecules will be emitting. Many of the emitting dye molecules will be far enough apart that they can be individually localized, so after collecting many thousands of frames a single, super-resolution image can be reconstructed to show the positions of every dye molecule (Fig.5). By eliminating the photobleaching step from PALM, much faster acquisition times are possible with STORM. However, STORM is highly reliant on the properties of the dye molecule to produce a high enough photon signal as well as having a good blinking density. If the dyes blink too fast, there could be a lot of crossover between neighboring dye molecules, preventing individual localization, but if they blink too slow it may not be possible to acquire enough frames to localize every molecule.
DNA-Based Point Accumulation for Imaging in Nanoscale Topography (DNA-PAINT)
DNA-PAINT is a newer technique than PALM and STORM, published in 2014 by Ralf Jungmann. DNA-PAINT takes advantage of the complementary nature of DNA strands to produce an effect similar to single-molecule blinking.
DNA exists as a double helix of two complementary DNA strands running in opposite directions to one another. The two DNA strands bind highly specifically to each other, so if two complementary strands are together in solution, they will spontaneously bind.
In DNA-PAINT, one DNA strand of a complementary pair is bound to the molecule of interest, the ‘docking’ strand, and the other DNA strand is fluorescently labeled, the ‘imager’ strand. When combined in solution, the imager strand binds the docking strand, producing fluorescence emission of a single molecule at the focal plane. The binding strength and concentration of the imager strand can be tuned to cause repetitive, transient binding at a rate similar to the best blinking dyes seen in STORM. Then, like in STORM, the stochastic binding of imager strands to docking strands on the structure of interest over thousands of frames is reconstructed to create a final super-resolution image, as seen in Fig.6.
Aside from the programmable binding rate, a significant advantage of DNA-PAINT is that any fluorescent dye can be used on the imager strand, making multi-color super-resolution imaging relatively simple.

Determining Resolution
Resolution in super-resolution localization microscopy is determined by two factors: localization accuracy and molecular density.
Localization accuracy is the position of a fluorophore in the lateral dimensions whereas molecular density is the density of labeled molecules in the sample. Both are equally important when determining resolution.
Localization Accuracy
Localization accuracy is determined by photon shot noise, the pixelation noise and the background noise from the sample. Assuming the use of an sCMOS with effectively small pixels and low background noise from the sample, the main factor that affects localization accuracy is the Gaussian function used and the number of photons captured.
To optimize localization accuracy, the most important consideration is to increase the number of photons detected. More detected photons will produce a taller and thinner peak on the Gaussian fit which can be localized with greater accuracy. This can be achieved with good fluorophore selection and a sensitive scientific camera.
The camera pixel size will have a small effect on localization accuracy, where a larger pixel will introduce more uncertainty as to where the photon landed on the pixel. However, a pixel size greater than the diffraction limit (>250 nm) will become the limiting factor for localization accuracy. An ideal pixel size should ensure correct Nyquist sampling.
Background fluorescence is noise from all other sources including camera noise, scattered light, non-specific labeling, autofluorescence and other sources of noise produced by the sample. This can be corrected by diligent sample preparation and choosing a camera with low noise characteristics.
Molecular Density
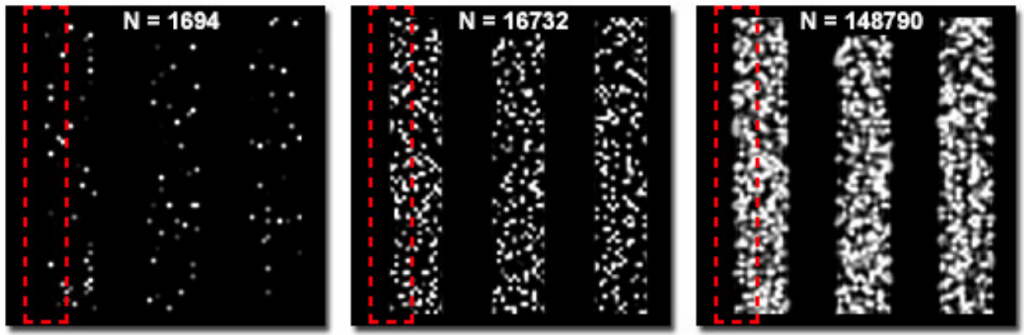
A high localization accuracy means nothing if there aren’t enough fluorophores present to resolve a structure. According to the Nyquist-Shannon theorem, the distance between two neighboring molecules should be twice as fine as the desired resolution. This means that if the localization accuracy is 20 nm, there should be a fluorophore every 10 nm for correct sampling. This relationship between localization accuracy and molecular density is necessary to understand how resolution should be determined in super-resolution microscopy.
Fig.7 shows the difference in molecular density between three simulated structures with the same localization accuracy. The edges of the structure are clearly defined in the image on the right but not so clear or completely undefined in the images in the middle and on the left respectively.
Reconstruction Algorithms
Achieving high quality data in super-resolution localization microscopy is not only dependent on the intensity of the fluorophore and the labeling density, but also on the ability of the localization algorithm to localize all the fluorophores and reconstruct the final image.
In general, a reconstruction algorithm will go through seven processes:
- Determining the noise level per pixel.
- Smoothing to remove background fluorescence.
- Finding the approximate positions of individual molecules. This is made easier by the previous two steps.
- Sub-pixel localization of molecules. This is the basis of achieving super-resolution data, localizing every point spread function of every fluorophore on every frame of data.
- Overcome the ‘crowded-field’ problem, where multiple fluorophores exist in the same spatial region and need to be individually localized.
- Post-processing. This allows the user to correct their data by: removing molecules with poor localization, merging reappearing molecules, removing duplicates, and drift correction
- Vizualisation of the final image
Multiple reconstruction algorithms exist with many labs choosing to design their own to better fit their fluorophores and their sample. Reconstruction algorithms are not designed to be one-size-fits-all, there are multiple parameters that need to be considered and adjusted and the user needs to understand exactly what they’re doing to get good quality data.
One of the most popular algorithms for reconstructing PALM and STORM data is ThunderSTORM (Ovesný et al. 2014). ThunderSTORM is an open-source, interactive and modular plug-in for ImageJ which gives researchers a lot of freedom to adapt it for their own purposes. It is powerful enough to perform complex analysis of localization microscopy data whilst remaining free to download and implement.
Other popular open-source algorithms for PALM and STORM offer higher speed reconstruction of data such as rapidSTORM (Wolter et al. 2012) and quickPALM (Henriques et al. 2010).
The most popular algorithm for DNA-PAINT is Picasso, designed by the Jungmann lab and can be downloaded for free from http://www.jungmannlab.org. It performs the same functions as other reconstruction algorithms and so can be used for any localization microscopy technique. It also contains DNA-PAINT specific functions such as the ability to design DNA origami structures and simulate DNA-PAINT data.
Summary
A question that should be asked of all techniques is what they have enabled us to achieve that was not possible before, and super-resolution localization microscopy has provided us with a wealth of new information. For papers concerning the usefulness of super-resolution localization microscopy and the development of the techniques we recommend:
The molecular organization of focal adhesion complexes (PALM)
Kanchanawong, P., Shtengel, G., Pasapera, A. M., Ramko, E. B., Davidson, M. W., Hess, H. F. & Waterman, C. M. (2010) Nanoscale architecture of integrin-based cell adhesions. Nature. Nov 25;468(7323):580-4. doi: 10.1038/nature09621
Liu, J., Wang, Y., Goh, W. I., Goh, H., Baird, M. A., Ruehland, S., Teo, S., Bate, N., Critchley, D. R., Davidson, M. W. & Kanchanawong, P. (2015) Talin determines the nanoscale architecture of focal adhesions. Proc Natl Acad Sci U S A. Sep 1;112(35):E4864-73. doi: 10.1073/pnas.1512025112
Bertocchi, C., Wang, Y., Ravasio, A., Hara, Y., Wu, Y., Sailov, T., Baird, M. A., Davidson, M. W., Zaidel-Bar, R., Toyama, Y., Ladoux, B., Mege, R. M. & Kanchanawong, P. (2017) Nanoscale architecture of cadherin-based cell adhesions. Nat Cell Biol. Jan;19(1):28-37. doi: 10.1038/ncb3456
The distribution of integrins inside focal adhesions (PALM)
Rossier, O., Octeau, V., Sibarita, J. B., Leduc, C., Tessier, B., Nair, D., Gatterdam, V., Destaing, O., AlbigèsRizo, C., Tampé, R., Cognet, L., Choquet, D., Lounis, B. & Giannone, G. (2012) Integrins β1 and β3 exhibit distinct dynamic nanoscale organizations inside focal adhesions. Nat Cell Biol. Oct;14(10):1057-67. doi: 10.1038/ncb2588
The molecular organization of the y-complex within the nuclear pore (STORM)
Szymborska, A., de Marco, A., Daigle, N., Cordes, V. C., Briggs, J. A. G. & Ellenberg, J. (2013) Nuclear Pore Scaffold Structure Analyzed by Super-Resolution Microscopy and Particle Averaging. Science. Aug 9;341(6146):655-8. doi: 10.1126/science.1240672
The arrangement of subunits in cytoskeletal septin filaments in cells (STORM)
Kaplan, C., Jing, B., Winterflood, C. M., Bridges, A. A., Occhipinti, P., Schmied, J., Grinhagens, S., Gronemeyer, T., Tinnefeld, P., Gladfelter, A. S., Ries, J. & Ewers, H. (2017) Absolute Arrangement of Subunits in Cytoskeletal Septin Filaments in Cells Measured by Fluorescence Microscopy. Nano Lett. Jun 10;15(6):3859-64. doi: 10.1021/acs.nanolett.5b00693
Review paper describing how super-resolution localization microscopy techniques have provided insights into HIV biology (PALM, STORM)
Hanne, J., Zila, V., Heilemann, M., Müller, B. & Kräusslich, H. G. (2016) Super-resolved insights into human immunodeficiency virus biology. FEBS Lett. Jul;590(13):1858-76. doi: 10.1002/1873-3468.12186.
Download As PDF
References
Bates, W. M., Huang, B., Dempsey, G. T., and Zhuang, X. (2007) Multicolor Super-resolution Imaging with Photoswitchable Fluorescent Probes. Science. 317(5845): 1749–1753. doi: 10.1126/science.1146598
Betzig, E., Patterson, G.H., Sougrat, R., Lindwasser, O. W., Olenych, S., Bonifacino, J. S., Davidson, M. W., LippincottSchwartz, J., Hess, H.F. (2006) Imaging intracellular fluorescent proteins at nanometer resolution. Science. 313(5793): 1642-5; DOI: 10.1126/science.1127344
Henriques, R., Lelek, M., Fornasiero, E. F., Valtorta, F., Zimmer, C. & Mhlanga, M. M. (2010) QuickPALM: 3D real-time photoactivation nanoscopy image processing in ImageJ. Nat Methods. May;7(5):339-40. doi: 10.1038/nmeth0510-339.
Jungmann, R., Avendaño, M. S., Woehrstein, J. B., Dai, M., Shih, W. M. & Yin, P. (2014) Multiplexed 3D cellular superresolution imaging with DNA-PAINT and Exchange-PAINT. Nat Methods. Mar; 11(3): 313–318. doi: 10.1038/nmeth.2835
Ovesný, M., Křížek, P., Borkovec, J., Svindrych, Z. & Hagen, G. M. (2014) ThunderSTORM: a comprehensive ImageJ plugin for PALM and STORM data analysis and super-resolution imaging. Bioinformatics. Aug 15;30(16):2389-90. doi: 10.1093/bioinformatics/btu202
Rust, M. J., Bates, M. & Zhuang, X. (2006) Sub-diffraction-limit imaging by stochastic optical reconstruction microscopy (STORM). Nat Methods. Oct;3(10):793-5. DOI: 10.1038/nmeth929
Schnitzbauer, J., Strauss, M. T., Schlichthaerle, T., Schueder, F. & Jungmann, R. (2017) Super-resolution microscopy with DNA-PAINT. Nat Protoc. Jun;12(6):1198-1228. doi: 10.1038/nprot.2017.024
Wolter, S., Löschberger, A., Holm, T., Aufmkolk, S., Dabauvalle, M. C., van de Linde, S. & Sauer M. 2012. rapidSTORM: accurate, fast open-source software for localization microscopy. Nat Methods. Nov;9(11):1040-1. doi: 10.1038/nmeth.2224.