
Introduction
High-content imaging (HCI) involves a powerful imaging system paired with smart analysis software, in order to parse hundreds of thousands of dense images into quantifiable data. As HCI involves maximizing the data output, HCI experiments can involve imaging millions of cells with multi-parameter analysis, resulting in the need for efficient, often automated, smart specialized analysis software. While it is also important to obtain the correct hardware for a HCI system, choosing the correct analysis programs is also vital in order to best analyze the vast quantities of data in a high‑throughput manner.
Often the factors that differentiate commercially-available HCI systems are in the software that is used to acquire, analyze, and manage high-content images. Computer-assisted image analysis is the key to most HCI projects, in order to sort through and manage the vast data rates generated with high‑content samples. The goals are to identify objects and accurately measure features of high‑content samples, which are typically highly confluent cell samples stained with multiple fluorophores.
In order to best analyze such samples, it is important for HCI analysis programs to have comprehensive and user-friendly systems, preferably with advanced graphical user interfaces (GUIs) designed around real-world workflows that would be used most regularly, such as user-specific image analysis tools. Scientists will have a good idea of the type of assay they want to run, meaning that an optimal image analysis algorithms, features, and parameters would need to be determined using positive and negative referenced controls. How much of this is done in the background, and how much training would be required for new users? The ease and speed at which analysis programs operate are critical for HCI, which is a technique based on efficient high-throughput analysis of large, dense samples.
Image Analysis
While the first step for HCI analysis is obtaining good images, the image acquisition side mainly depends on the HCI hardware such as the sCMOS camera resolution, objective numerical aperture, and image focus. Images should be the same file type, resolution, and color depth in order to maximize efficiency.
Once images are acquired, the baton passes to analysis software for image processing. What do you need your analysis software to do? Image analysis involves these basic steps:
- Adjust the image in order to get optimal image quality, often via post-acquisition background correction
- Apply a threshold in order to differentiate objects and signal from the background
- Segmentation to separate individual objects, each image becomes a collection of objects
- Objects are further selected based on suitable criteria
- Features are extracted from objects
While an image may be a dense collection of cells and tissues, through analysis this image is converted in collections of ‘objects’ (each cell ideally being a separate object), and objects are selected based on certain ‘features’, be it size, shape or presence/absence of certain biological structures/processes. This overall process is shown in Fig.1.
Primary object identification is often done through fluorescent staining, in order to differentiate regions of interest from the background or noise via fluorescence contrast. Numerous objects or features can be selected with other fluorescent stains, depending on the number of different non-overlapping wavelengths the HCI system can support.

Each of the steps in Fig.1 will be discussed in further detail. The initial steps of analysis have the goal of separating the signal from the background. This typically involves optimizing the signal, reducing any patterns/artifacts through adjustment, and applying a threshold.
Image Optimization
Raw acquired images require optimization before reliable analysis can take place, in order to reduce error and improve contrast. This optimization involves highlighting the signal from the image and differentiating it from the background. This optimization is reliant on the images having a high signal-to-noise ratio (SNR), this can be greatly improved by using a sensitive camera. Read noise and dark current are both sources of noise in imaging and can be reduced: read noise via elegant sensor design and the use of gain states that grant sub-electron read noise; and dark current via the use of low exposure times and/or air/liquid camera cooling. Having a highly sensitive camera leads to lower exposure times, resulting in faster and more efficient HCI experimentation, as well as lower dark current noise. Other sources of noise such as photon shot noise can be lessened through the use of certain denoising algorithms, which can be used either during acquisition or during the post-processing steps.
When acquiring images with a high SNR, it will be easier to differentiate between signal and background, allowing for thresholding and selection of objects from an image.
Other factors to consider when optimizing HCI images for analysis involve bias, filtering, and smoothing.
Bias in the imaging system can reduce signal, but can be simple to deal with. Bias refers to an overall or local deviation in image intensity, potentially caused by variation in the light source, uneven field illumination, artifacts in the well, or uneven focus. This kind of bias is generally low frequency and not in sharp focus (more of a soft blooming effect across the image), meaning it can be dealt with using filtering the image based on frequency, or the use of smoothing functions
Filtering involves eliminating parts of the image based on spatial frequency, for example, high-pass filters remove variations that exist amongst many pixels, such as out-of-focus light.
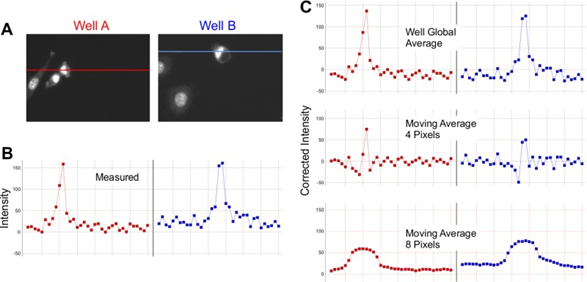
Smoothing involves using a moving average across the image in order to reduce noise and background, but it differs in effectiveness depending on the resolution of the image, the size of the objects to identify, and the size of artifacts or blooming effects. As seen in Fig.2, certain levels of moving average can be beneficial, while others can be detrimental.
Establishing A Threshold
After image optimization is the identification of objects within the image, made easier thanks to the improved signal to background. After background correction, a threshold is typically established in order to eliminate pixels that are too bright or dim.
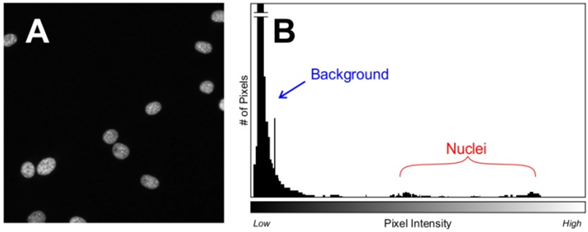
Establishing a threshold is made easier by using stable fluorescent markers and by taking images with consistent exposures, so that images are internally consistent and automated processes can be applied without additional steps. However, if signal intensity changes across an image (spatially) or over time (temporally) it would be inaccurate to set a manual threshold, so more sophisticated software may be required in order to set thresholds for each image. Thresholds can be automatically applied using algorithms that can determine which pixels are part of the background and which are part of the signal, but these often involve a number of assumptions to be made about each image. Some relatively safe assumptions include the assumption that most pixels will be background, and the threshold for the signal can be set against this, as seen in Fig.3, which also demonstrates how signal intensity can vary across a standard cell image.
After establishing a threshold, pixels are determined to be either above or below and can be separated. With the background pixels ignored, the signal pixels can be grouped into objects, and these objects can potentially be segmented. This identification of objects and possible further segmentation all involve their own algorithms, some using a grid structure or a gradual filter. The development of such HCI analysis algorithms is an active area of research, with algorithms carrying as much emphasis as new microscopy applications.
Object Identification and Selection
Biological samples often involve complex shapes, background detritus, auto‑fluorescence of background objects, overlapping samples, and objects being cut off by the border of the image (example of this seen in Fig.3), where some of the nuclei are cut off at the edges of the image, at what point are they still included as objects? This can vary between software packages. Images taken with an XY tile scan often involve a 5-15% overlap in order to best stitch the images together, if the overlap is a certain size these border objects could be counted twice. HCI object identification algorithms need to be able to make snap decisions on such situations, across thousands of different conditions.
Pixels identified to be part of objects (on the positive side of the threshold) reveal further information from the image now that the background can be ignored. Object size, shape, intensity, kinetics, homogeneity, change over time, and repeatability can all be extracted once identified. Some objects, such as the cell nuclei seen in Fig.3, can contain further sub-objects of different intensities and are subject to further selection algorithms.
Once objects have been differentiated from the background, then identified and selected, certain facets of these objects can be extracted and further studied. These points of interest on the objects are often referred to as features, and the feature extraction process marks one of the final stages of HCI analysis.
Feature Extraction
Upon starting HCI analysis it is vital to know which features are of interest from the sample, as HCI software can often identify many features per cell or object and it may be necessary to trim the data down to the most significant factors. For example, if imaging brain slices, what is the most important data for your experiment? Cell number, neuron:astrocyte ratio, synapse number, length of axons, dendritic area, network area, and many more could potentially be extracted from high-content images with the correct stains. Establishing the desired features early on streamlines analysis and prevents large amounts of time and processing being spent on undesired features. Analysis packages from manufacturers may have preferences for which features they extract, but the most generalized feature extractions are to do with physical size, shape, and pixel intensity. The most important question to ask is whether or not a cellular feature is relevant to the dataset and worthy of inclusion.
Common extracted features include object intensity, nuclear features, and regional analysis, as detailed below.
Intensity is a simple measurement as pixel intensity is the main measure used by scientific cameras, this data is available as arbitrary grey levels or raw photoelectrons.
Nuclear features are often used due to the ubiquitous fluorescent nuclear dyes DAPI and/or Hoechst, allowing for measurement of the nuclear area, nuclear intensity, and cell number. As the vast majority of (non-dividing) cells have a single nucleus, the nuclear stain can be used in order to count cells, due to its uniform shape and sharp edges (see Fig.3 for an example). The nucleus can also reflect cell morphology changes, as it often changes shape along with the cell. Stressed or dying cells often have larger (necrosis) or smaller/more intense (apoptosis) nuclei, but this can be seen in dividing cells as well. By measuring the DNA content of the cell in this manner, much information can be extracted.
Regional analysis goes one step further than nuclear analysis, distinguishing specific regions or compartments within a cell. A cell can be a dense and complex object, containing a nucleus, cytoplasm, membrane, organelles, proteins, and much more, meaning that compartmentalization can reveal much about a cell. When imaging tissues or larger samples, regional analysis can be used to differentiate between functional zones across the sample, such as the heart or eyes of a fruit fly or zebrafish. HCI imaging programs typically use masks or halos to distinguish features from other features or objects, an example of this can be seen in Fig.4.
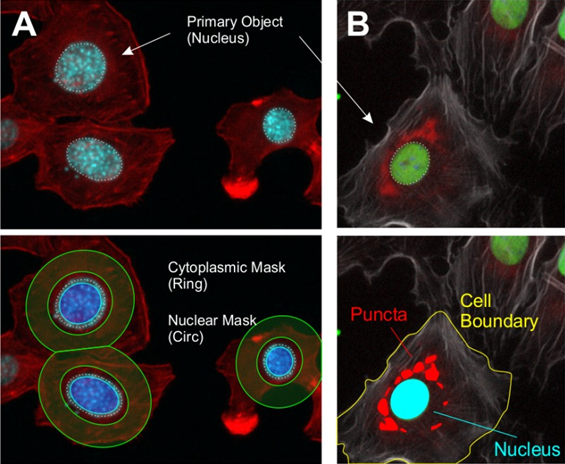
Based on Fig.4, some important distinctions need to be made. When establishing a nuclear boundary in order to generate a nuclear mask, note that the edge of the nucleus is not included, with the mask not including the outer few pixels of the nucleus. This edge part of the nucleus is known as the perinuclear region, and a number of important processes occur here. At what point should a nuclear mask stop? In order to include the perinuclear region, some of the cytoplasm may also be included in the nuclear mask. A similar issue presents for the cytoplasmic ring mask, the rings do not perfectly include the cytoplasm, clipping into the background and onto boundaries between cells. The size and width of this ring is also an important measure, needing to include as much cytoplasm as possible without containing unnecessary background or overlapping into other cells. Essentially, feature extraction is customizable and should be modified with the desired data in mind.
In this manner, extracted features contain the highly-filtered data generated from each high-content image. With thousands of such images taken over time across large samples, it is vital to establish HCI software that allows for easy extraction of desired characteristics. Alongside highly-optimized HCI analysis software, researchers using HCI should also not forget to practice good data hygiene and store/manage the large volumes produced from HCI analysis.
Summary
After obtaining a HCI system and taking quantitative images of samples, the HCI process is not complete without extensive automated analysis. There are many commercial analysis programs available for HCI, and it is important to be well-informed of the analysis process in order to determine which kinds of software should be used. By deciding which features of interest would generate the desired data, the process can be focused on those cellular objects, streamlining analysis and filtering out the background, unwanted data, or areas of low-quality imaging.
References
Assay Guidance Manual, Editors: Sittampalam G.S., Grossman A., Brimacombe K., Arkin M., Auld D., Austin C.P., Baell J., Bejcek B., Caaveiro J.M.M., Chung T.D.Y., Coussens N.P., Dahlin J.L., Devanaryan V., Foley T.L., Glicksman M., Hall M.D., Haas J.V., Hoare S.R.J., Inglese J., Iversen P.W., Kahl S.D., Kales S.C., Kirshner S., Lal-Nag M., Li Z., McGee J., McManus O., Riss T., Saradjian P., Trask O.J.Jr., Weidner J.R., Wildey M.J., Xia M. and Xu X. Bethesda (MD): Eli Lilly & Company and the National Center for Advancing Translational Sciences (2012), available https://www.ncbi.nlm.nih.gov/books/NBK53196/
Buchser W, Collins M, Garyantes T, et al. Assay Development Guidelines for Image-Based High Content Screening, High Content Analysis and High Content Imaging. 2012 Oct 1 [Updated 2014 Sep 22]. In: Sittampalam GS, Grossman A, Brimacombe K, et al., editors. Assay Guidance Manual [Internet]. Bethesda (MD): Eli Lilly & Company and the National Center for Advancing Translational Sciences; 2004-. Available from: https://www.ncbi.nlm.nih.gov/books/NBK100913/