
Introduction
The sensitivity of a scientific camera is vital, with insufficient sensitivity it may not even be possible to acquire clear images of your sample. At Teledyne Photometrics sensitivity is paramount and is our approach to highly sensitive cameras is twofold: maximize signal collection, and minimize noise levels. While the former is dependent mostly on QE and pixel size, the latter is a much larger subject.
Noise on scientific cameras is error that has a number of sources, but can largely be categorized into two categories:
- Random noise, such as read noise, dark current, and photon shot noise. These are not constant from frame to frame and can be described by statistical distributions, and reduced by averaging successive frames.
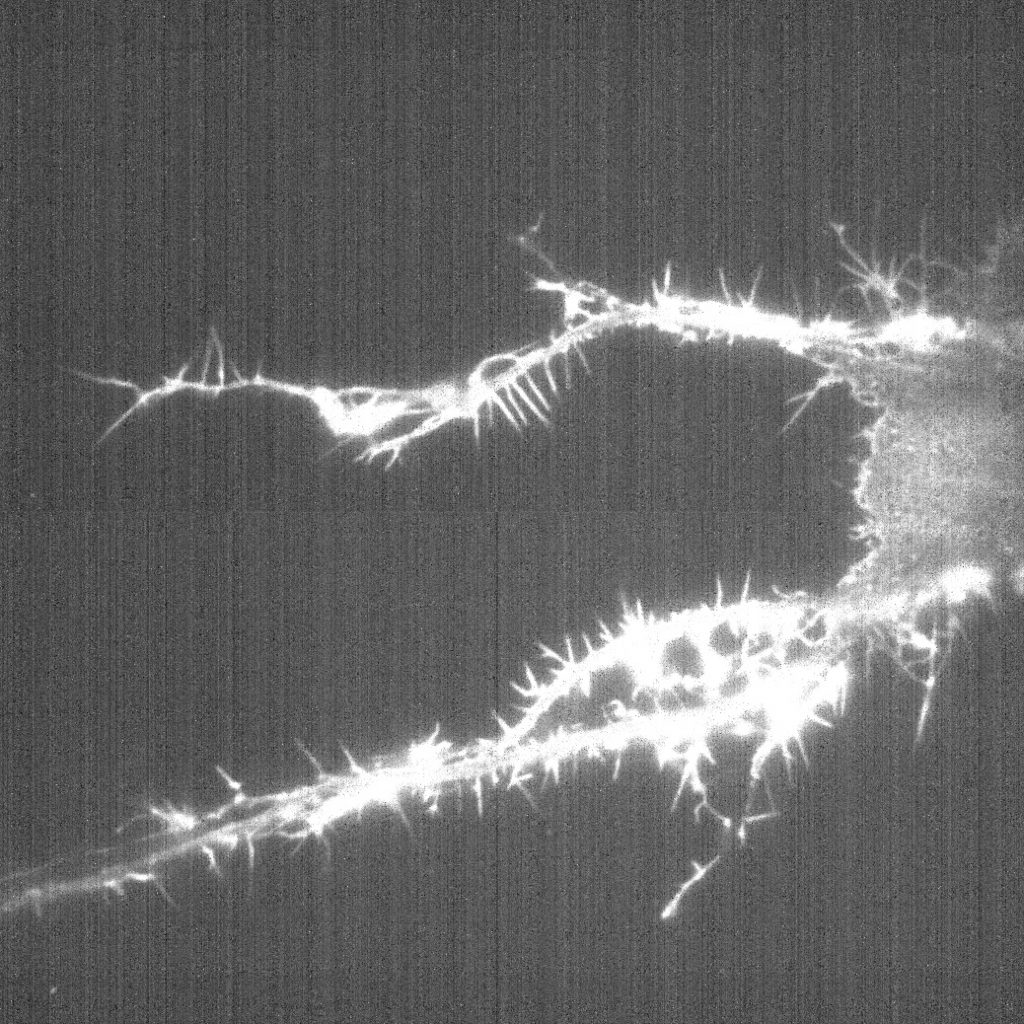
- Pattern noise, caused by small differences in specific sensor pixels resulting in a ‘fixed’ pattern of brighter or darker pixels. This occurs at fixed locations without significant change frame to frame, so instead of being reduced by frame averaging like random noise, it is worsened by averaging, as seen in Fig.1.
This article will focus on types of pattern noise, as sources of random noise are discussed elsewhere, such as the Camera Sensitivity article.
Pattern Noise
Unlike random noise, which affects image quality on all scientific cameras, pattern noise is primarily an issue for CMOS-based imaging devices. Pattern noise is often most noticeable on older CMOS cameras as column noise due to the amplifiers present in each column, and the combination of both column-to-column variation and pixel-to-pixel variation, with the multiple amplifiers on the CMOS sensor all introducing additional pattern noise. For this reason, pattern noise is an understandable concern for researchers who plan to use sCMOS cameras for quantitative imaging.
Pattern noise comes mostly from two sources:
- Dark Signal Non-Uniformity (DSNU)
- Photo Response Non-Uniformity (PRNU)
The basic difference between these is that DSNU is present even without illumination (hence ‘dark’), while PRNU is dependent on illumination (hence ‘photo’).
Dark Signal Non-Uniformity (DSNU)
Noise in scientific cameras is typically fluctuating, random noise aspects such as read noise are error that can be positive or negative, meaning that with a signal of zero and negative noise, it is possible that certain pixels could have a negative signal, which becomes challenging to display from a software point of view. Because of this, the intensity values for scientific cameras do not start from zero, and the offset is typically used to add an arbitrary value (such as 100) onto every pixel, to avoid signals dropping below zero. This leads to scientific cameras having a background effect that gives each pixel a non-zero value, even without light, which is known as the bias.
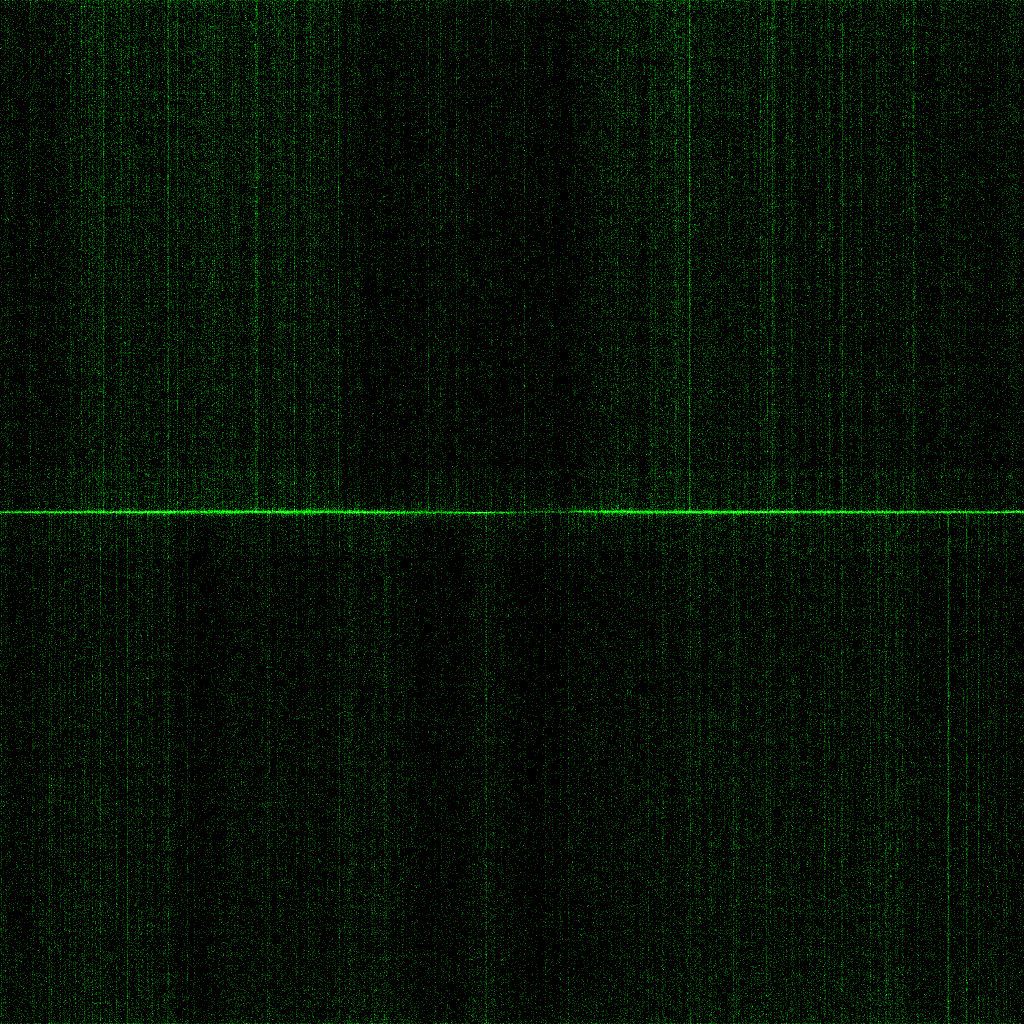
However, even with the highest-quality engineering, the bias can never be truly equal across all pixels because of CMOS pixel-to-pixel and column-to-column variations. This causes a fluctuation in the bias, and this is what we call the DSNU, which is completely independent of illumination. An example of DSNU can be seen in Fig.2.
While DSNU is unaffected by illumination, it is affected by camera sensor temperature and exposure time. This is because DSNU is caused by differences in pixel responsivity and “hot” or “cold” pixels respond differently to changes in temperature than most pixels. Increasing exposure time effectively increases the heat on the sensor which has the same result.
It is therefore recommended to calculate DSNU in the same conditions and at the exposure time that the camera will be used to get a true understanding of the noise being introduced.
A full explanation of how DSNU is quantified and the calculations is outside the scope of this article but a comprehensive procedure can be found in the EMVA 1288 Release which gives camera manufacturers the EMVA 1288 Standard for Measurement and Presentation of Specifications.
As a general overview, to calculate DSNU it is essential to start with an expected bias value from which the fluctuation can be compared to. Average pixel values for the entire sensor should then be compared to this bias value and plotted, with DSNU reported as the root mean square (RMS) of these values in electrons.
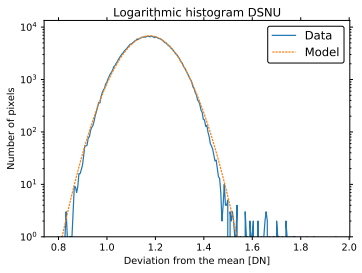
Photo-Response Non-Uniformity (PRNU)
Scientific cameras convert photons to electrons, producing an analog signal. For this to be interpreted in software by a computer, the electron signal is converted to grey levels, producing a digital signal. The conversion factor between electrons and grey levels is known as the gain.
It is expected that when the number of detected electrons increases in a linear fashion, the response of the camera in grey levels should also linearly increase. However, because of small variations in individual pixels, the gain may not be equal across the entire sensor. This variation (or non-uniformity) in gain across a sensor is the PRNU.
PRNU for a specific camera sensor can be calculated by measuring the response of every pixel on the sensor and comparing them, under the exact same amount of illumination. This makes calculating PRNU a very precise process because accurately measuring the output of each individual pixel requires uniform illumination, a light source that can evenly light the entire camera sensor to the edges. This is to ensure that it is the output due to the gain that is being measured and not simply differences in illumination intensity.
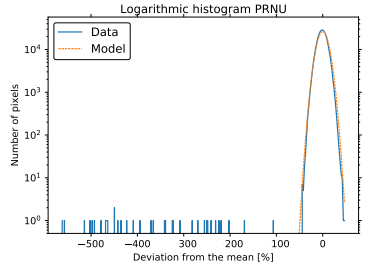
Typically, PRNU is calculated at different levels of light saturation, usually described as a percentage of the full-well capacity, with 25% and 50% saturation being common. After acquiring thousands of frames of data at different saturation levels and averaging them, PRNU is relatively simple to calculate as it is normally distributed, and can be expressed as a percentage of the average signal, as seen in Fig.4.
For example, a camera tested at 50% saturation outputs an average signal of 10,000 e–. In a normal distribution, the range of output signals was 9000 e– to 11,000 e–. The camera, therefore, has a PRNU of 10% because the signal fluctuates by 1000 e- from the average. Quality scientific cameras typically have a PRNU below 0.1%.
It is very important to note that a PRNU calculation is only useful if it is performed at a signal level close to the actual signal level you intend to use. For example, a PRNU value taken at 50% full well will not give accurate noise information if the camera is primarily being used for lower light imaging below 1% full well. To give an example of how much this can vary, older sCMOS devices have:
- ~0.1% PRNU at 50% full well (~15,000 e–)
- ~0.4% PRNU at 500 e– signal
- ~6% PRNU at 10 e– signal, equal to a very significant 0.6 e– noise at this light level
The PRNU value at 10 e– signal is far more relevant to the low light imaging conditions used in many sCMOS camera applications. Scientific camera datasheets will typically only report 50% full well data because this is the EVMA 1288 standard, but this can be very misleading depending on sample and application. Checks should be made at the relevant signal level in order to establish the PRNU. Similar to DSNU, a full explanation of the PRNU calculation can be found in the EMVA 1288 Standard for Measurement and Presentation of Specifications.
Impact Of Pattern Noise
Overall, the signal-to-noise impact of pattern noise (both DSNU and PRNU) is rarely significant when using high-quality scientific cameras. However, the image quality impact of visible columns can still exist despite the low noise values. Column-to-column and pixel-to-pixel variation need to be controlled by careful engineering and field-programmable-gate-array (FPGA) correction – these are staples of sCMOS camera development here at Teledyne Photometrics.
It is tempting to want a number that quantifies image quality but image quality is determined by a combination of parameters. Pattern noise is a part of that but does not define it. Scientific cameras should always be personally demonstrated, evaluated and image quality compared and quantified before a decision is made, preferably on relevant systems and samples. The numbers stated on a datasheet do not always tell the full story, especially when it comes to disguising noise.
Summary
DSNU and PRNU are collectively referred to as “pattern noise” sources, this is in contrast to “random noise” sources such as read noise. Unlike random noise, pattern noise can only be reduced by circuit design and FPGA correction.
DSNU describes the fluctuation in the bias and is illumination independent. To minimize the quantitative impact, it should have an e– RMS value below the read noise. PRNU describes the gain uniformity and is illumination dependent, it is very important to perform a PRNU calculation at the signal level typically being used to get accurate noise information.
Pattern noise plays a big part in image quality but DSNU and PRNU numbers do not tell the full story. It is always recommended to demonstrate scientific cameras before purchase to make sure the image quality matches the needs of your application.