
Introduction
Tissues, cells, and the smaller structures inside cells (organelles) are mostly water and are therefore transparent. Imaging tiny see-through bags of water results in images that don’t contain a lot of information, and in microscopy, it is vital to have some sort of contrast or stain that will give areas of the sample color and make them far easier to see. In addition, what if you only want to image some of the smaller structures inside a cell, like a nucleus or a cell membrane? Coloring the entire cell would make it impossible to localize the areas you are interested in.
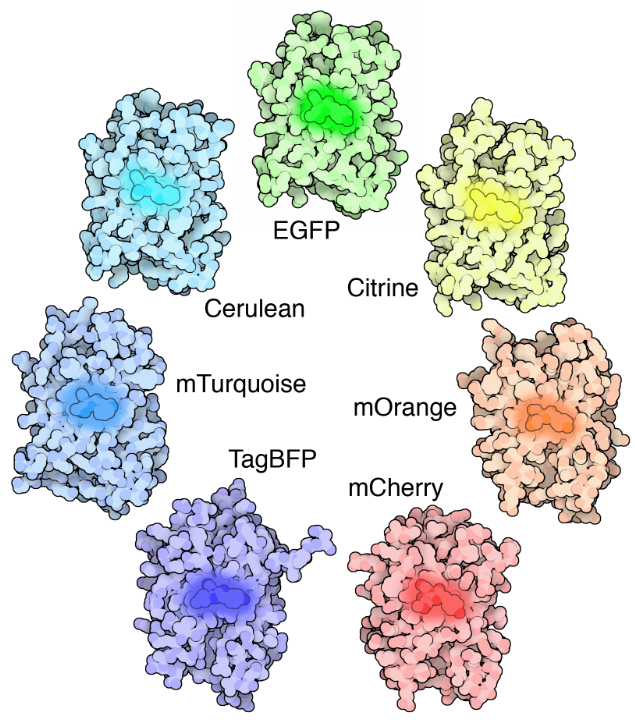
Fluorescence solves both these issues of contrast and localization. Fluorescence is where an object will emit light after absorbing light. Many different objects exhibit fluorescence, such as minerals (the word fluorescence coming from the mineral fluorite), deep‑sea fish (most famously the jellyfish Aequorea victoria, from which green fluorescent protein (GFP) was discovered), plants, chemicals and many more.
Fluorescent molecules (known as fluorophores) are used to label samples, and fluorophores are available that emit light in virtually any color. In a fluorescent microscope, a sample is labeled with a fluorophore, and then a bright light (excitation light) is used to illuminate the sample, which gives off fluorescence (emission light). In this manner, samples are highly contrasted to the black background as the fluorophore emits a bright-colored light. By localizing these fluorophores to the area of interest a clear image of any part of a cell can be taken, making fluorescence microscopy a powerful tool for life sciences.
Brightfield vs Fluorescence Imaging
In brightfield microscopy, the sample is illuminated with transmitted white light. This creates an even illumination of the sample under the microscope to observe highly contrasted, stained or naturally pigmented samples. However, brightfield is not sufficient to distinguish between transparent/translucent, unstained cells or cellular structures to study processes of interest.
Fluorescence microscopy relies on the use of fluorophores, molecules that emit light of a specific visible wavelength when exposed to light of a different wavelength. When these fluorophores are bound to a targeted structure of interest, photons emitted from the fluorophore can be used to visualize this structure of interest. The benefit of fluorescence microscopy is that the targeted structures are illuminated while the undesired areas of the sample have little to no fluorescence, allowing for easy targeting and imaging.
Why Molecules Fluoresce
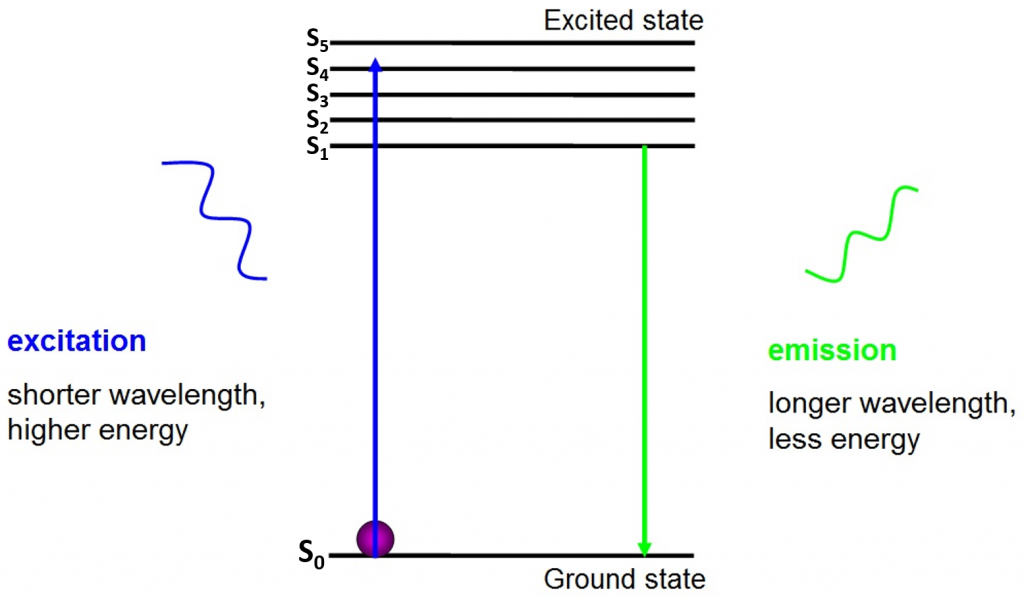
The origin of fluorescence is electrons moving freely around the active fluorophore and releasing absorbed energy, as seen in Fig.2.
Before excitation, electrons are in the lowest energy state available to them – the ground state (S0). When an electron is hit with a photon of a certain energy range, the electron absorbs the energy of the photon and jumps up to a higher energy state (S1, S2, or S3). To return to the ground state (S0), the electron releases the additional energy as the emission of a photon. The energy of this photon is less than the excitation energy so it has a longer wavelength. This is why emission light has a longer wavelength than the excitation light and can appear as a different color.
The emitted photon is usually in the visible spectrum and can be viewed under a microscope if there are enough excited fluorophores. The wavelength of the released photon is specific for every fluorophore and this predictability allows for easy fluorescence imaging.
Fluorescence Intensity Factors
While fluorophores can emit fluorescence of a predictable wavelength, it is also important to know what factors control fluorescence intensity. Without an intense enough emission of light, the fluorescence won’t be detectable with a microscope.
Quantum Yield
The quantum yield (ϕ) of a fluorophore is the ratio of the number of released photons to the number of absorbed photons. The quantum yield is often expressed as a value from 0-1, which 1 being 100% efficiency of photon conversion. It is also important to note that each fluorophore has a unique pH, ionic strength, and temperature for optimal fluorescence efficiency.
Extinction Coefficient
Every fluorophore has a different capacity to absorb photons even if they are within an appropriate wavelength range to excite it. If a fluorophore is exposed to a photon appropriately matching its excitation wavelength, the probability that a photon will be absorbed is a measurable characteristic and known as the extinction coefficient (ε).
A fluorophore’s quantum yield and extinction coefficient are often displayed together to describe how bright the fluorophore is shown to be in experimental settings.
Fluorescence Lifetime
When a fluorophore electron absorbs a photon it does not immediately release a longer wavelength photon. The release of some energy between excited energy states is known to take different lengths of time. The amount of time that an electron spends in the excited state before releasing a photon and returning to the ground state is a measurement of its fluorescence lifetime. The lifetime of every fluorophore is unique and can be measured experimentally. When using fluorescent dyes experimentally, it is helpful to their lifetime, especially for applications that require high speed, such as calcium imaging neurons.
Excitation Wavelength Intensity
Most fluorescent microscopy setups include a source of light that can be tuned to output the desired wavelength range. Many fluorescent light sources can also be adjusted for excitation intensity to increase the number of photons moving through the light path. In a fluorescently-labeled sample that is exposed to its excitation wavelength, every fluorophore will not be activated at the same time. By increasing the excitation intensity and increasing the number of photons reaching the sample, there is a higher probability that more fluorophores will be excited.
Photostability
Photostability is the ability of a molecule or organism to resist damage. In fluorescence microscopy, fluorophores will eventually stop absorbing oncoming photons and go into a permanent dark state. As an organism gathers more fluorophores in the dark state, the appearance of the labeled target reduces, and the sample is said to be photobleaching. In fluorescence microscopy, steps are often taken to reduce the amount of photobleaching experienced during experimentation. Some measures include a reduction in the intensity of light interacting with the sample and the use of specialized fluorescent dyes that do not remain active for as long as other dyes.
Fluorescence Microscopy
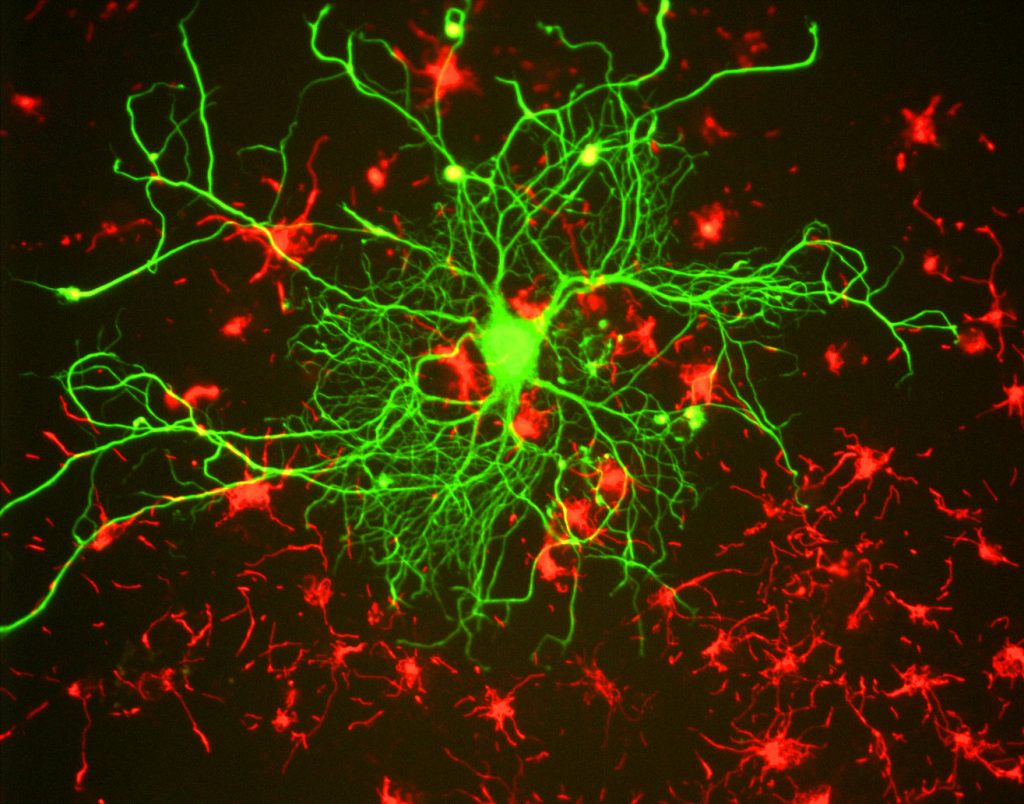
For researchers, the main benefit of fluorescence is the ability to use fluorescence microscopy, where samples are labeled/stained with a fluorescent substance such as a dye, antibody or protein, allowing images to have contrast. By targeting these fluorescent labels, researchers can select what they want to see. This is demonstrated in Fig.3, where a neuron can be clearly seen among astrocytes, as they are labeled with different colors of fluorescent marker.
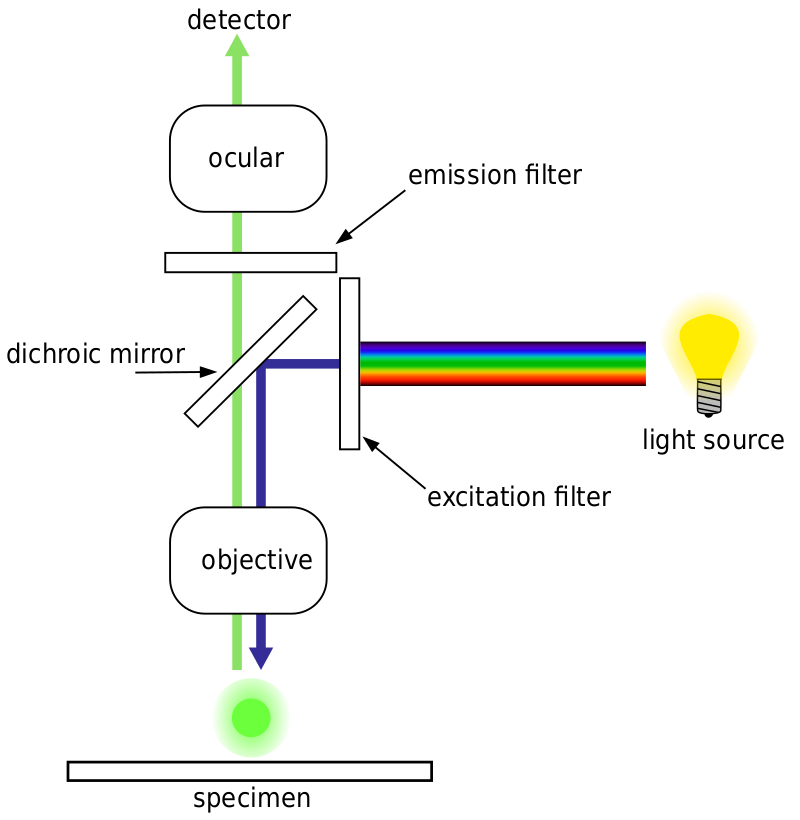
In general, for fluorescence microscopy, a sample is labeled with fluorescent markers (typically specific for certain parts of the sample). The sample is then illuminated with the specific excitation wavelength for the fluorophore, and the resulting emission fluorescence is received by the detector, usually a sensitive scientific camera.
Most fluorescence microscopes are epifluorescence microscopes, where excitation and emission are done through the same light path. Both the excitation illumination and the emitted fluorescence pass through the microscope objective and usually are filtered in order to just detect the fluorescence. This setup is shown in Fig.4.
Autofluorescence
Some structures, biological organisms, and general microscopy samples can naturally exhibit fluorescence, known as autofluorescence. This is different from fluorescence from labeled samples, but it often shares similar wavelengths, meaning that autofluorescence microscopy samples can obscure artificially added fluorescence and interferes with detection, reducing signal. It is important to know if your samples exhibit autofluorescence, as this will affect any fluorescence imaging done unless specific wavelengths are used to avoid it.
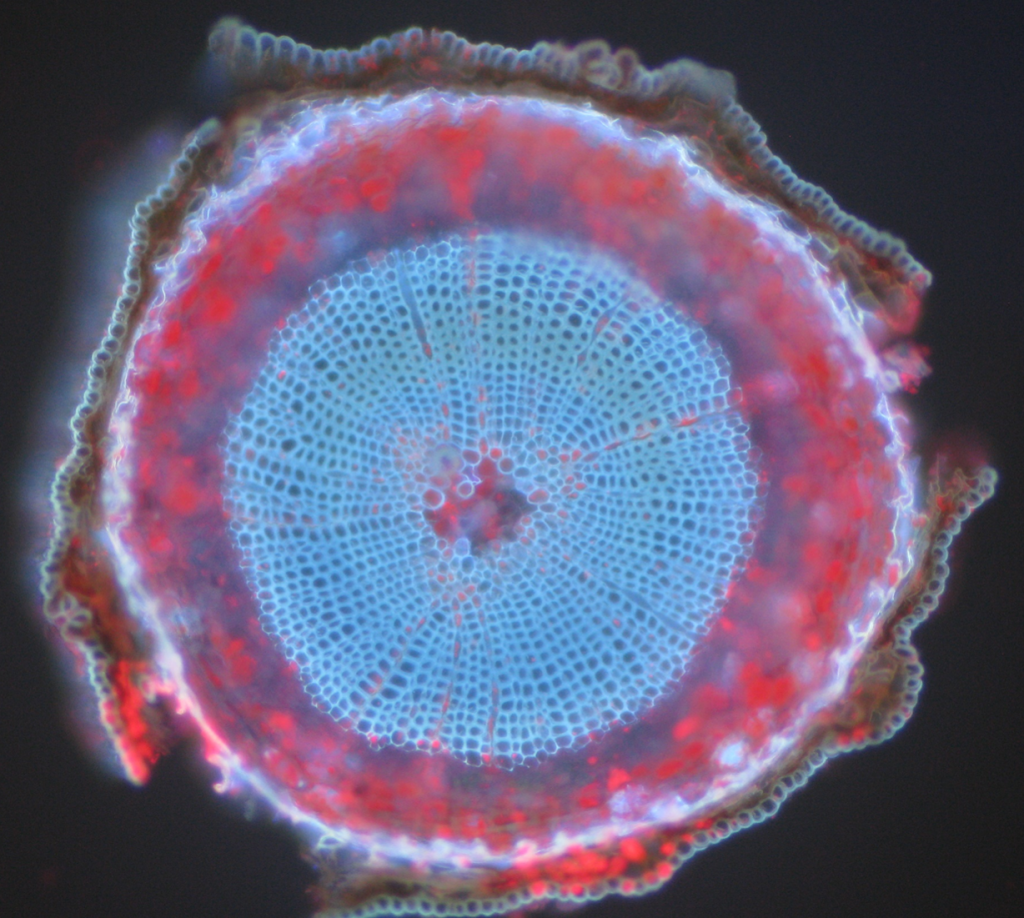
Common examples of autofluorescent objects are mitochondria, lysosomes, collagen and some amino acids such as tryptophan, tyrosine, and phenylalanine. Most notably, autofluorescence is common in plants due to their use of chlorophyll and other fluorescent molecules like lignins and carotenes. Fig.5 shows the different colors of autofluorescence from an unlabeled Scots pine sample.
Summary
Since the introduction of the first fluorescent dye, fluorescence microscopy has been a heavily utilized tool to visualize cells and cellular structures with higher specificity than traditional brightfield microscopy techniques. Researchers can manipulate the structure, optical properties, and probe of interest in fluorescence experiments to obtain relevant data. Such flexibility has allowed fluorescence microscopy to be included in many life science experiments.
Depending on the type of sample and fluorophore, a scientific camera should be carefully selected to achieve the best imaging results.
References
- Light Microscopy. (2009) Nature Milestones. MacMillan Publishers Limited, 6-22.
- Lavis, L. D., & Raines, R. T. (2008). Bright Ideas for Chemical Biology. ACS Chemical Biology, 3(3): 142–155.
- Liu, Y., Lilly, D. (2017) Crystal Structures if Cyanine Fluorophores Stacks onto the End of Double-Stranded RNA. Biophysical Journal, 113, (11): 2236-2343.
- Berezin, M. Y., Achilefu, S. (2010). Fluorescence Lifetime Measurements and Biological Imaging. Chemical Reviews, 110(5): 2641–2684.
- Stockert, J., Blazquez-Castro, A. (2017) Fluorescence Microscopy in Life Sciences. Sharjah, UAE. Bentham Science Publishers.
- Berezin, M. Y., & Achilefu, S. (2010). Fluorescence Lifetime Measurements and Biological Imaging. Chemical Reviews, 110(5): 2641–2684.
- Denk, W., Strickler, J., Webb, W. (1990). Two-Photon Laser Scanning Fluorescence Microscopy. Science. 248, (1951): 73-76.
- So, P. (2002). Two-photon Fluorescence Light Microscopy. Macmillan Publishing Group.
- Schermelleh, L., Heinztmann, R., and Leonardt, H. (2010). A Guide to Super-Resolution Fluorescence Microscopy. The Journal of Cell Biology 190 (2): 165-175.
- Betzig, E., Patterson, G.H., Sougrat, R., Lindwasser, O. W., Olenych, S., Bonifacino, J. S., Davidson, M. W., LippincottSchwartz, J., Hess, H.F. (2006) Imaging intracellular fluorescent proteins at nanometer resolution. Science. 313(5793): 1642-5
- Rust, M. J., Bates, M. & Zhuang, X. (2006) Sub-diffraction-limit imaging by stochastic optical reconstruction microscopy (STORM). Nat Methods. 2, (10):793-5.
- Rego, E., Shao, L., Macklin, J. Winoto, L., Johansson, G., Kamps-Hughes, N., Davidson, M., and Gustasson, M. (2010) PNAS. 109 (3): e135-a143.
- Jungmann, R., Avendaño, M. S., Woehrstein, J. B., Dai, M., Shih, W. M. & Yin, P. (2014) Multiplexed 3D cellular super-resolution imaging with DNA-PAINT and Exchange-PAINT. Nat Methods. 11(3): 313–318
- Jiang, X., Wang, L., Carroll, S., Chen, J., Wang, M., and Wang, J. (2018) Challenges and Opportunities for Small Molecule Fluorescent Probes in Redox Biology Applications. Antioxidants & Redox Signaling. Mary Ann Liebert, Inc.