
Introduction
An often-asked question in imaging is whether two objects are in the same or separate places. Resolution, the ability to tell two nearby features apart, is a key parameter of microscope optics that becomes more challenging at smaller length scales. Yet, this has surprisingly little to do with the microscope’s ability to magnify. In this technical note, the underlying principles that define resolving power, and the conditions necessary to achieve that resolution in a microscope image, are considered.
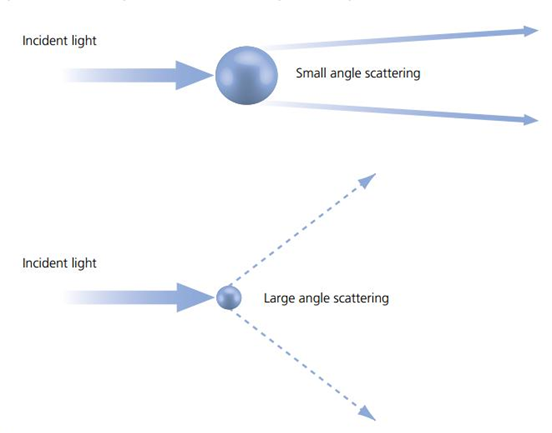
Small Objects Scatter Light Over Wide Angles
Microscope imaging can typically be split into transmitted light techniques where light passes through a sample from a source opposite the objective lens, and fluorescence-based techniques where light is re-emitted from the sample due to an interaction with light. In both cases, the microscope’s ability to differentiate fine details is limited by the diffraction behavior of light waves. Diffraction causes the light from the sample to spread out, and this spreading limits our ability to resolve.
For transmitted light techniques, the diffraction behavior is determined by the scattering of light from features in the sample. Scattering occurs when light encounters a change in refractive index, such as at the interface of an object. The refractive index, n, is a measure of how much light slows as it passes through the material of that object. The speed of light is a constant in a vacuum, but slower in materials denser than a vacuum. Common refractive indexes are 1.0 for vacuum, 1.33 for water, 1.37-1.39 for biological materials, 1.57 for glass and a number just slightly greater than 1.0 for air.
There’s an inverse relationship between object size and the maximum angle at which light is scattered. As illustrated in Fig.1, objects that are small relative to the wavelength of incoming light scatter the light across wider angles than larger objects. For clarity, the light that didn’t interact with the sample is excluded from the drawing in Fig.1. At extremely small particle sizes, scattered light leaves the object in all directions. This means the smaller the detail in a structure we’re trying to resolve, the greater the spread of light coming from it.
Fluorescent molecules emit in many directions. When examined in bulk, fluorescent molecules typically radiate light in all directions. Although individual fluorescent molecules can emit photons in a small range of angles, with the influence of molecular movement even single fluorescent molecules can be considered to be emitting in all directions.
The Microscope Limits What Can Be Resolved
So why does the emission of light in all directions influence resolution? The limiting factor of microscope resolution is how broad a range of angles of light from the sample the microscope objective can collect. For example, if a small object scattering light at a wide range of angles was imaged using a microscope objective, only a subset of that light would be collected – this would be indistinguishable from a larger object emitting a narrower range of angles. This ‘coarsening’ of length scale displays as blurring of the microscope image.
The range of angles that a microscope objective can collect is represented by its numerical aperture (NA). There are two key determining factors for NA – the refractive index (n) of the medium between the objective and the sample, and the size of the objective lens aperture. The size of the aperture controls the range of angles that can be transmitted to the detector. Fig.2 illustrates the optical path of a modern infinity-corrected microscope for different size apertures.
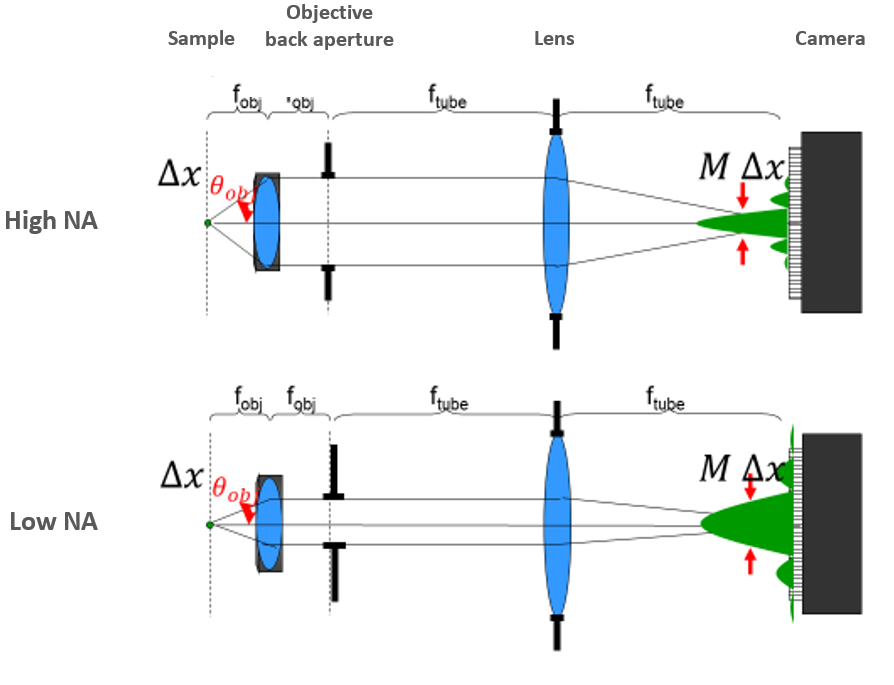
The NA is calculated from the refractive index in front of the objective and the half-angle (θ) of light that the lens transmits from the sample towards the detector.
NA = n * sinθ
The more open the aperture, the more angles of light that can pass through the lens to the sample, and the higher the NA. At its largest, the angle would be defined by the radius and focal length of the lens itself, but many objectives are made with smaller back apertures to control for aberrations at the periphery of lenses and other issues.
If microscopes are imaging through dense mediums such as oil, the refractive index (n) is greater, and the higher the NA. This is why higher magnification lenses often use oil and other immersion objectives.
Immersion Objectives
A perfect air lens, meaning the gap between the front element of the objective and the sample is filled with air, can have a maximum NA of around 1.0 due to the refractive index of air. To achieve higher NA, it is necessary to fill the space between the objective and the sample with immersion media with n greater than 1.0, such as water (n=1.33), glycerol (n=1.46) or immersion oil (n=1.51).
When light travels between mediums with different refractive indexes at an angle, the light slows and is bent, this is refraction. Typically this occurs when light emitted from the sample hits a glass-air interface. As illustrated in Fig.3, when air fills the interface gap between sample and objective, the higher angles are bent at the interface and fail to be collected by the objective. In contrast, when oil (much higher refractive index) fills the gap, light is bent less and is all collected by the objective.
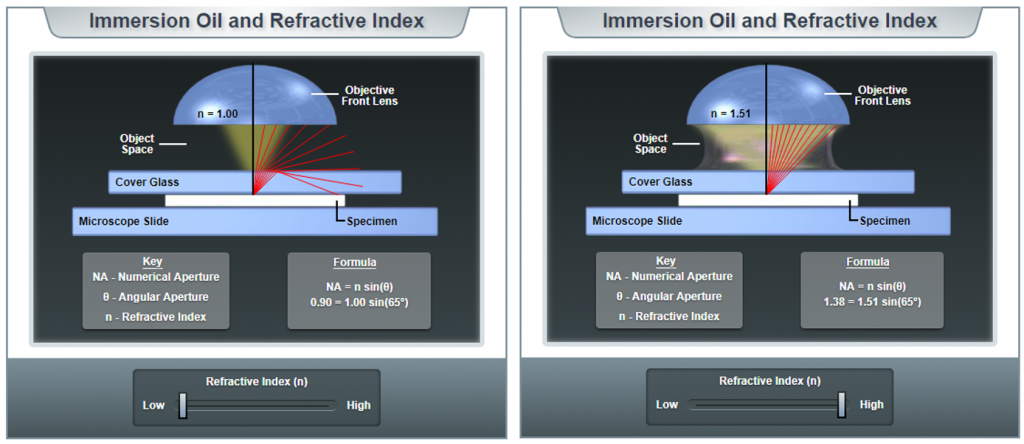
For thin samples mounted with index-matching medium, the glass and sample can be considered to have the same refractive index. When sample thickness increases, or where no index-matching medium can be used (live cell imaging), choosing immersion objectives that use water or glycerol as index matching fluids, being similar to the sample, can be more effective.
The Diffraction Limit
The maximum resolving power of an optical system is defined by the following: how close together can two small features be such that the blurring of their images doesn’t lead to them appearing as one feature? This is a loose definition that depends on the wavelength of light used.
In general, the larger the back aperture the wider the angles we can collect, the larger the NA, and the higher the resolution. The theoretical maximum angle that light can be collected by a lens is 180 (it would have to be a huge lens), making the maximum half-angle 90. Realistically, half-angles above 72 cannot currently be achieved. For an air lens with half-angle 72, the NA would then be 0.95 and the maximum resolution (the smallest object that could be observed) of the image would be 320 nm. Two objects closer than 320 nm would not be resolved and would appear as one object, and anything smaller than 320 nm would appear as a blurry blob 320 nm in size. This is the diffraction limit to imaging.
Sampling Diffraction-Limited Objects
Diffraction-limited imaging defines the size of the smallest objects in the image. Anything smaller will be blurred by the microscope to the diffraction-limited size. Since the diffraction limit is set by the NA of the objective and the wavelength of light used, it may be mistakenly assumed that we are always performing diffraction-limited imaging. However, this is not necessarily true depending on the size of the camera’s pixel and the magnification of the system.
The total magnification (M) of the optical system makes objects in the sample appear M times larger at the camera. For example, a microscope camera might have 2000×2000 pixels with each pixel measuring 6.5 µm by 6.5 µm. Depending on the magnification, the pixel will sample different regions in the sample. Using a 10x lens, one 6.5 µm by 6.5 µm pixel would sample 650 nm by 650 nm of the sample. In contrast, using a 100x lens that same pixel would sample 65 nm by 65 nm.
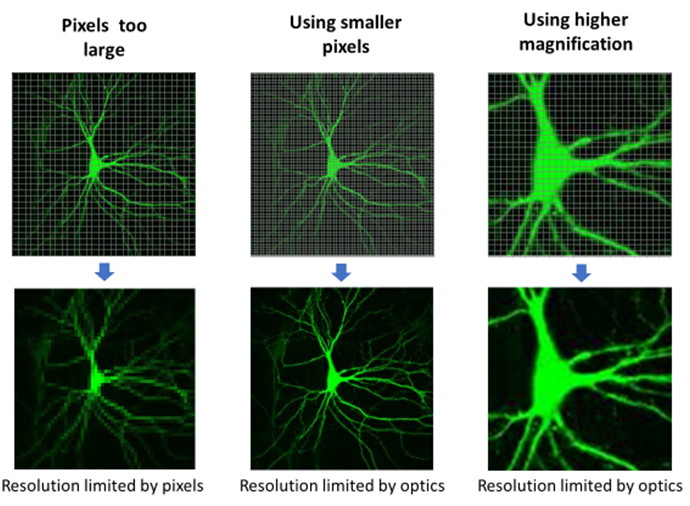
Camera pixel size should be matched to the diffraction-limited blur. In order to differentiate between two objects, one must make a measurement in between them. By convention, the pixel size needs to be 1÷2.3 (~0.44) as large as the smallest object to be imaged. If the smallest object in a sample is 1 µm, the pixel size should be at least 0.44 µm in order to best image the sample. Pixel sizes larger than this will lose information, known as undersampling, while pixel sizes smaller than this provide no extra information, known as oversampling.
Fig.4 illustrates a case where the sensor’s large pixels undersample the spatial information in the neuron. Using smaller pixels or increasing the magnification solves the problem.
For the example given earlier of a diffraction-limited resolution of 320 nm, one would need pixels sampling every 140 nm in the image to truly achieve this resolution. With a 6.5 µm pixel, 45-50x magnification would provide pixels of an appropriate size. Magnification has no influence on the optical blur of the microscope but does allow appropriate sampling to recover all the information transmitted by the microscope.
Localization Resolution
As a single point of light is diffraction-limited and spreads out before meeting the sample, the image of a point on the sample is blurred. This blur is known as the point spread function (PSF) and has a characteristic shape known as an Airy disk, as illustrated in the map of intensity vs position shown in Fig.5.
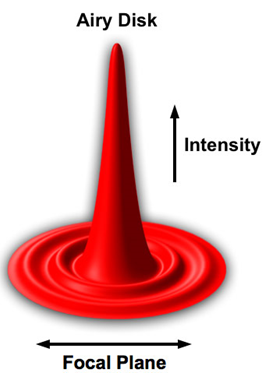
This Airy disk has most of the light power distributed in the central lobe, with lower amounts distributed to secondary lobes. If the area of the center of the peak can be located with greater precision, this can indicate the location of the point source. The precision with which one can localize the center of the PSF generated by a single point source depends on the number of photons detected from that source.
A single photon could fall anywhere within the PSF, but if 100 photons are collected from a single point source, the localization precision could increase by a factor of 10. In the example used previously, where the resolution was 250 nm for a perfect air lens, collecting 100 photons from a unique point source, allows the center to be localized within 25 nm. This means with many photons, we could determine the location of point sources within the sample with great precision and resolve finer details.
However, this localization works only when we know that the photons within the PSF come from only one point source – which is not the case in conventional microscopy where fluorescent molecules are far more densely packed than the PSF size. Controlling the conditions so that single point sources can be imaged in a sample consisting of many point sources underpins PALM/STORM super-resolution microscopy techniques (Schermelleh et al. 2019 for review).
Summary
Our ability to image fine details in microscopy is limited by the resolving power of the microscope and of the camera. The microscope resolution is determined by the numerical aperture of the objective, which depends on the refractive index of immersion medium used, and the size of the back aperture of the objective, combined with the wavelength of light from the sample.
References
Abramowitz, M. 2003 Microscope Basics and Beyond, Olympus America, Scientific Division.
Schermelleh L., Ferrand A., Huser T., Eggeling C., Sauer M., Biehlmaier O. and Drummen GPC. 2019 Super-Resolution microscopy demystified. Nature Cell BIolog v21:72 72–84
Figures 1 is taken from the Particle Size Analysis blog on Laser Light Scattering (https://technologypharmaceutical.wordpress.com/2014/12/10/laser-light-scattering-method/)
Figures 2 & 4 were derived from the lecture notes of Dr. Jerome Mertz’ BE517 class at Boston University and modified for clarity.
Figure 3 was derived from the Immersion tutorial on Nikon’s MicroscopyU website (https://www.microscopyu.com/tutorials/immersion)
Figure 5 was derived from Numerical Aperture and Resolution on the Nikon MicroscopyU website (https://www.microscopyu.com/tutorials/imageformation-airyna)