
Introduction
Similarly to how two magnets will only attract each other when they are close enough, fluorescence energy can also be transferred between fluorescent molecules if they are in extremely close proximity. This is the principle behind Förster Resonance Energy Transfer (FRET), which is a technique used to determine whether two fluorescent molecules are within a certain distance of one another.
Proposed by Theodor Förster in 1946 and confirmed experimentally by Stryer & Haugland (1967), FRET takes advantage of the principle of energy transfer between donor and acceptor fluorophore molecules, which only occurs once the molecules are within a certain distance of each other.
Principle of FRET
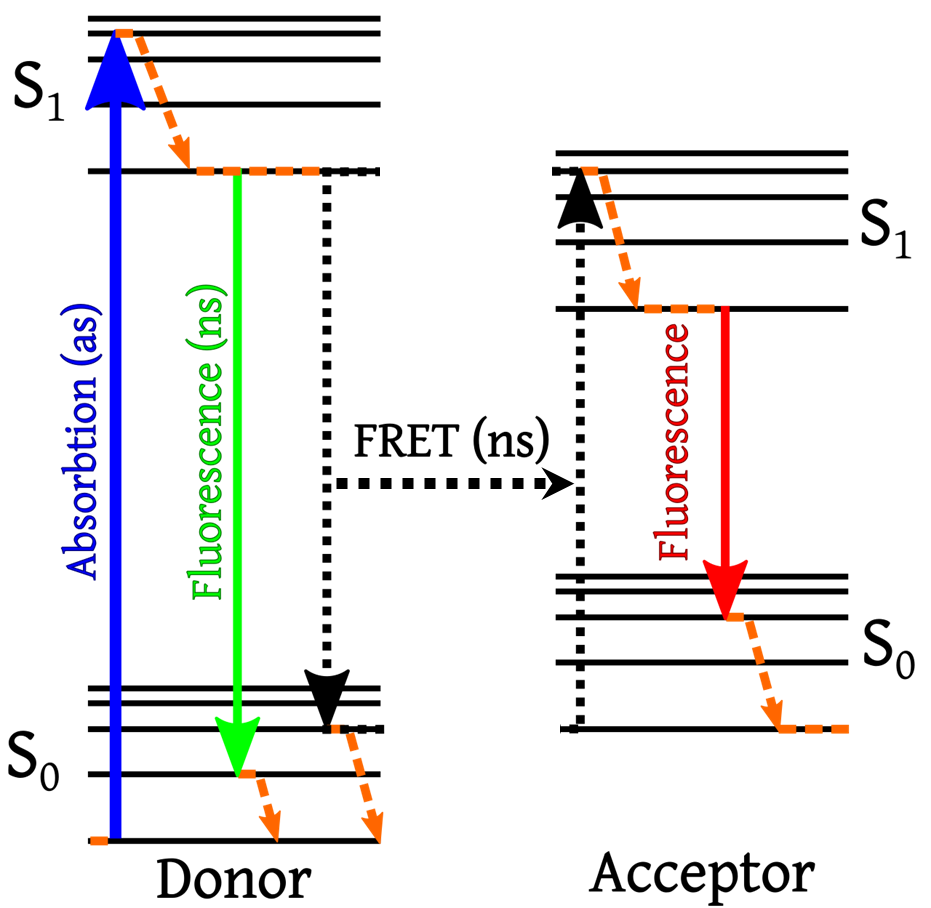
FRET is a type of energy transfer that occurs between two fluorophores in close enough proximity. This process is highlighted by a Jablonski energy diagram in Fig.1.
As outlined by Fig.2, three requirements are needed in order for FRET to occur successfully:
- The two fluorescent molecules must have overlapping spectra, so that energy from one can excite the other (Fig.2A). The classic example uses a cyan fluorescent protein (CFP) and a yellow fluorescent protein (YFP), as CFP emission is close enough in the spectrum of light to excite the YFP, enabling FRET.
- The two fluorescent molecules must be within 10 nm of each other or there will be no energy transfer (Fig.2B). This is the main attraction of FRET, as it can be used to determine how close together certain molecules are.
- The two fluorescent molecules must be in the correct orientation, namely not perpendicular to each other (Fig.2C). Only if the two fluorophores are parallel will they transfer energy between each other.
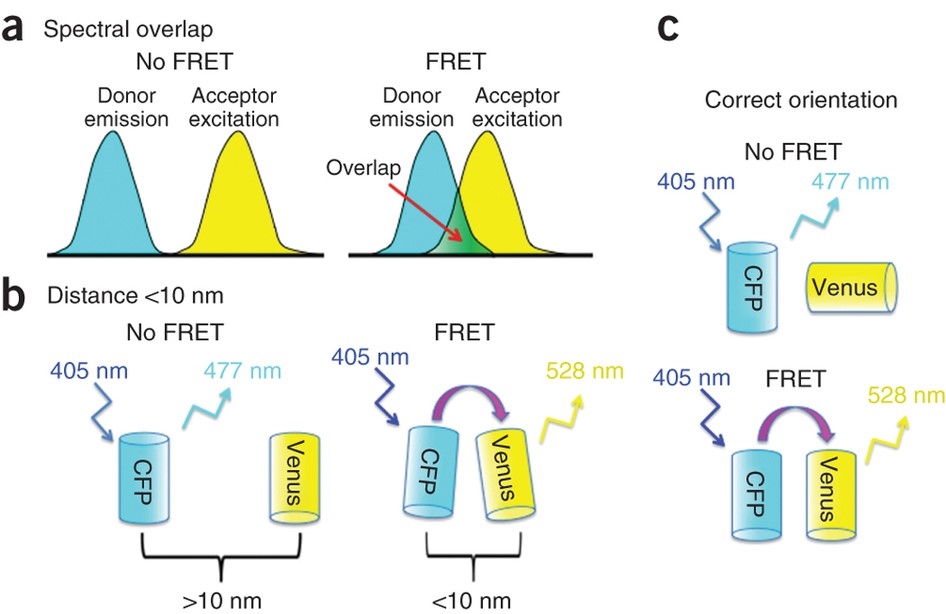
FRET uses a fluorescent donor molecule in an excited state to transfer energy to a fluorescent acceptor molecule (Hussain, 2012), with the energy transfer itself not producing fluorescence. What can be detected is the decrease in fluorescence of the donor molecule and the increase in fluorescence of the acceptor molecule. This energy transfer can only occur when the molecules are in the range of 1‑10 nm apart (Fig.2B).
FRET Applications
In essence, FRET is used as a ‘spectroscopic ruler’ that can measure the distance between molecules, and FRET will indicate if the molecules are too far apart (no fluorescence change) or within 1‑10 nm of each other (changes in fluorescence). In addition, the rate of FRET is directly proportional to the distance separating the two molecules, which allows this distance to be quantified until the molecules reach a separation distance where FRET no longer occurs.
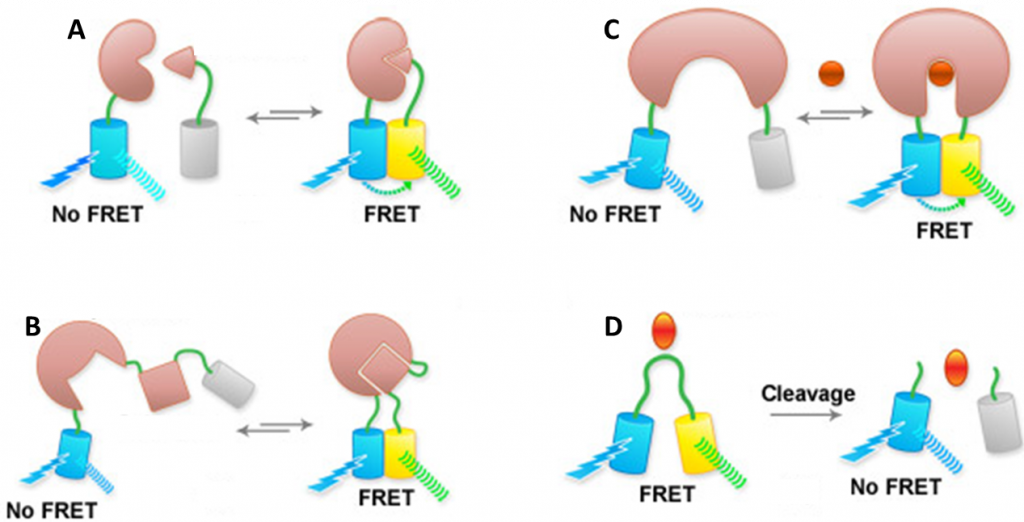
The distance information gathered from single-molecule FRET makes it an ideal technique for applications that investigate the structure and dynamics of proteins and nucleic acids. By attaching fluorophores to two different proteins that typically bind together, or both fluorophores to one protein that changes shape after binding, FRET can be used as an elegant marker for protein binding, analyzing the rate and speed of protein interactions. More examples of FRET applications can be seen in Fig.3.
Recent studies using FRET involve the visualization of protein conformational changes, specifically enzymes during their functional cycle (Dyla et al. 2016) and monitoring DNA synthesis in real-time (Fijen et al. 2017). For more details on the legacy of FRET and it’s developments into the future, see the review by Sun et al. 2011.
Popular fluorophores for use with FRET are fluorescent protein pairs, especially cyan fluorescent protein (CFP) and yellow fluorescent protein (YFP), which are both variants of the classic green fluorescent protein (GFP). These proteins can be attached to proteins through convenient genetic engineering, and CFP/YFP have overlapping spectra and are ideal for FRET, as seen in Fig.1 and Fig.2, with optimized CFP-YFP being the most effective and widely-used pairing for FRET measurements.
Some techniques can be used to analyze FRET, such as fluorescence lifetime imaging microscopy (FLIM), which monitors the exponential rate of decay of fluorophore emission on a nanosecond timescale, as a quantifiable characteristic of different fluorophores. FLIM studies can give values on FRET efficiency, and these biophysical techniques can play off each other in combined FLIM-FRET measurements.
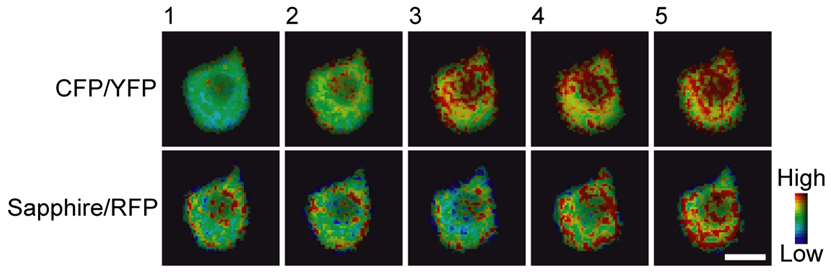
FRET is also a powerful tool for visualizing signal transduction in living cells, due to the use of fluorescent proteins (can be added to live cells with genetic engineering) and extremely fast timescales. This makes it possible to perform calcium imaging and other studies on dynamic fast-moving processes. This is shown in Fig.4 and other work by Niino et al. (2009).
Cameras for FRET
Due to FRET occurring over such a short timescale, a high-speed camera is vital in order to not miss out on information when imaging fast moving particles or dynamic processes. These single-molecule experiments can be over a small field of view (FOV), so a sCMOS camera is useful for the ability to restrict the full FOV to a smaller region of interest (ROI) which retains the full width while drastically increasing the speed.
Due to the potentially low signals and the high speed events, a low exposure time will be a must, meaning that the cameras also require high sensitivity and a high signal to noise ratio. The best camera technology for high speeds and high sensitivity is sCMOS, this will also result in less photobleaching on live samples as the light exposure is so low.
Summary
FRET is a powerful and widely-used single-molecule fluorescence technique, where the use of the technique is limited only by the imagination and the requirements seen in Fig.1.
References
Förster T. (1946) Naturwissenschafien. ;6:166–175.
Stryer L. and Haugland R. P. (1967). Energy transfer: a spectroscopic ruler. Proc Natl Acad Sci USA, 58(2), 719–726.
Broussard J.A, Rappas B, Webb DJ, Brown CM. (2013) Fluorescence resonance energy transfer microscopy as demonstrated by measuring the activation of the serine/threonine kinase Akt. Nat Protoc, 8(2) 265-81.
Dyla M, Andersen JL, Kjaergaard M, Birkedal V, Terry DS, Altman RB, Blanchard SC, Nissen P, Knudsen CR. (2016) Engineering a Prototypic P-type ATPase Listeria monocytogenes Ca(2+)-ATPase 1 for Single-Molecule FRET Studies. Bioconjug Chem 21;27(9) 2176-87.
Fijen C, Montón Silva A, Hochkoeppler A, Hohlbein J. (2017) EA single-molecule FRET sensor for monitoring DNA synthesis in real-time. Phys Chem Chem Phys. 8;19(6) 4222-4230.
Niino Y, Hotta K, Oka K (2009). Simultaneous Live Cell Imaging Using Dual FRET Sensors with a Single Excitation Light. PLOS ONE 4(6): e6036. https://doi.org/10.1371/journal.pone.0006036
Sekar R.B. & Periasamy A. (2003). Fluorescence resonance energy transfer (FRET) microscopy imaging of live cell protein localizations. The Journal of cell biology, 160(5), 629–633. https://doi.org/10.1083/jcb.200210140
Sun Y, Wallrabe H, Seo SA, Periasamy A. (2011) FRET microscopy in 2010: the legacy of Theodor Förster on the 100th anniversary of his birth. Chemphyschem. 12(3):462–474.