
Introduction
There are two significant challenges in biological imaging that conventional fluorescence microscopy cannot overcome. Firstly, biological specimens are 3-dimensional structures so to fully understand them we often need to construct 3-dimensional images. Secondly, many processes biologists would want to study occur inside biological structures, but other cell features such as the cell membrane block a clear view.
These problems are difficult to overcome due to the need to pass light through the entire sample to illuminate the chosen image plane. This gives no control over where within the light path the returning light comes from. Light from out of focus planes, and from bright features above and below the desired plane cannot be blocked with conventional fluorescence microscopy.
Confocal microscopy offers the solution to this issue. Confocal microscopy uses optical sectioning to take multiple, thin, 2-dimensional slices of a sample to construct a 3-dimensional model from them. This process removes the out-of-focus light from other planes. Compared to other optical sectioning techniques, Spinning Disk confocal microscopy is high-speed, high-sensitivity and simple to implement. This makes it a very common choice for studying 3-D structure, fast dynamic processes, long-term time-lapse or details inside the cell membrane, all possible with live cells.
Optical Sectioning
Out-Of-Focus Light
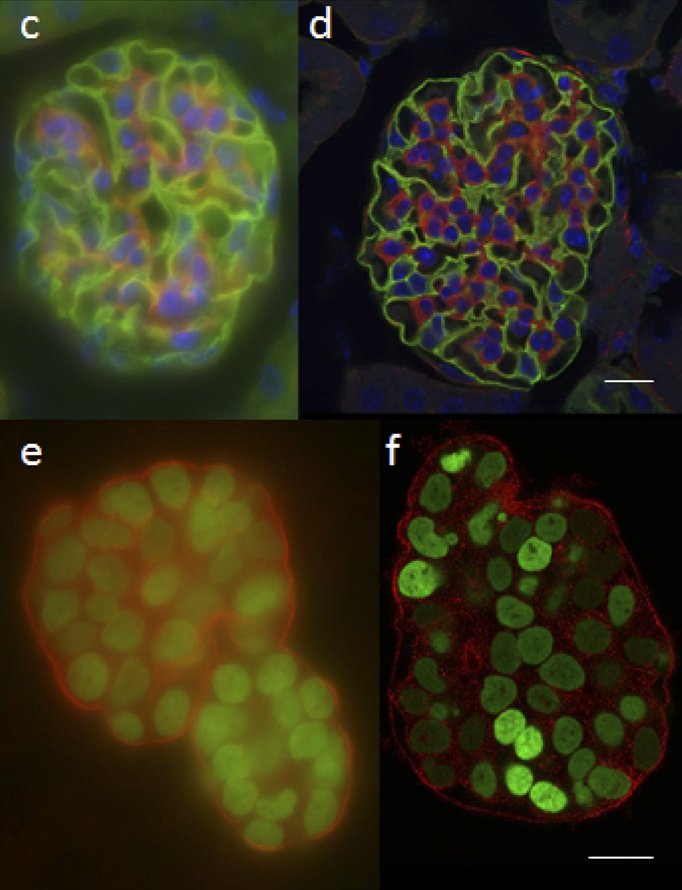
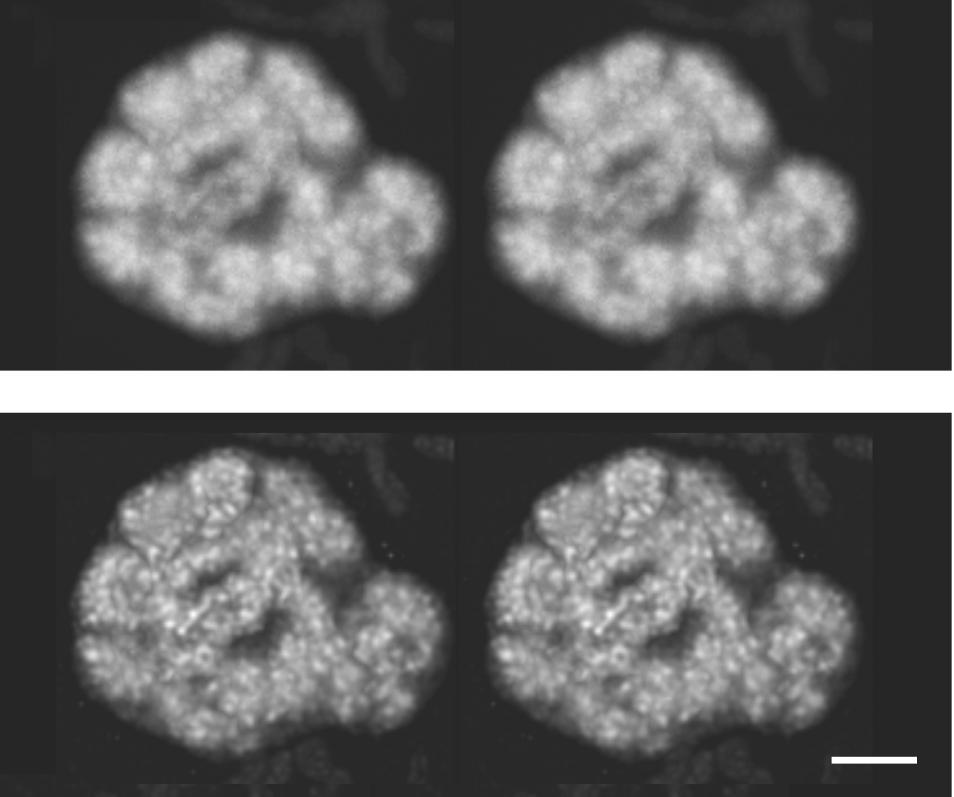
The main challenge to accurate and clear 3-D image reconstruction is how to deal with light that comes from above or below the sample plane. A conventional fluorescence microscope can focus on a particular plane but has no way of preventing out-of-focus light from reaching the detector. As most biological samples are 3-dimensional structures with fluorescent signal emission across the whole thickness of the sample, this out-of-focus light can considerably obscure whatever fine details are the microscopist’s target, as is evident in Figure 1.
This is particularly challenging when attempting to observe processes occurring inside cells, which will be obscured by fluorescence from the cell membrane.
Understanding 3-dimensional structure also requires the ability to resolve distinct details. The axial (z-) resolution of a conventional fluorescence microscope is however poor – on the order of 2.5 μm – much larger than the scale of many biological features.
The solution to out-of-focus light is to add a pinhole into the same focal plane as the specimen (giving us the name ‘Confocal’ microscopy). This principle is demonstrated in Figure 2. Light from fluorophores above and below the focal plane does not converge tightly enough to pass through the pinhole, and so is blocked from reaching the detector. This can improve axial resolution to around 500nm, as well as improve image contrast.
Laser Scanning Confocal Microscopy
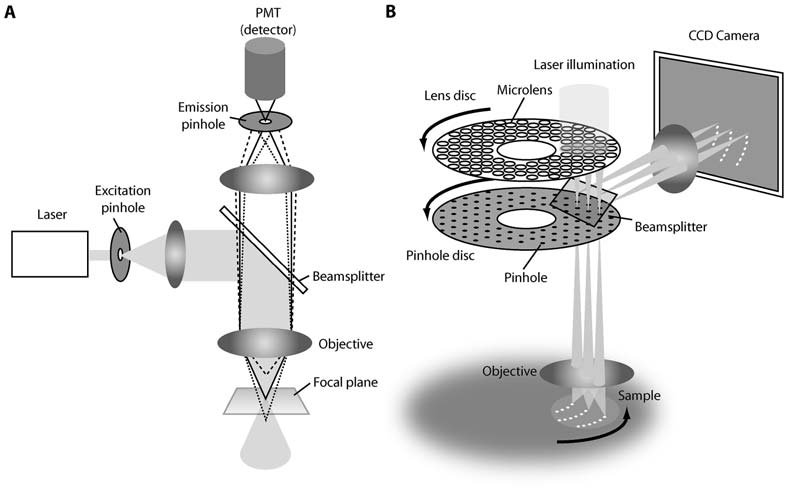
The first design of confocal microscope uses a laser beam which passes through a single pinhole in the excitation light path, with the emission light from the illuminated point passing through a separate pinhole to a detector, a photomultiplier tube (PMT). To generate an image, this light path is raster-scanned across the sample in 2 dimensions, then an image is reconstructed from the detected light. A piezo Z-stage is then used for the z-direction.
This technique generates high-quality images, but at the cost of very slow speed, on the order of 1 second per image. Additionally, the poor efficiency of the photomultiplier tubes used to detect light in laser scanning confocal combined with the highly concentrated illumination beam cause considerable photobleaching and photodamage to live cells. Another technique is therefore needed for live cell work, or for fast processes.
Nipkow-Petran Disk
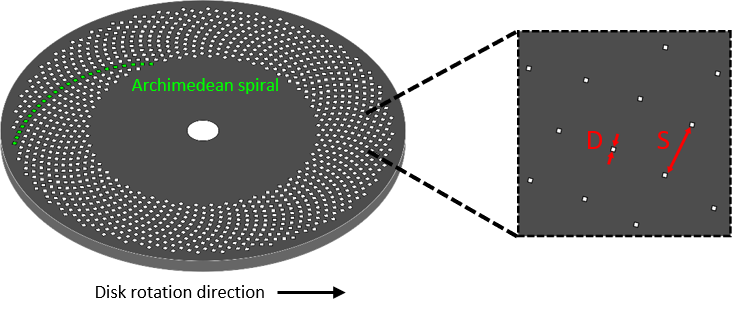
Spinning disk confocal microscopy solves the scanning problem by using multiple pinholes. The primary means of achieving this is through arranging pinholes in a spiral pattern, etched into an opaque disk (Figure 3). When spun, the pinholes scan across entire image rows in sequence. The holes are positioned so that every part of the image is scanned as the disk is turned.
Each area of the image is scanned by a single pinhole (typically) every 30° rotation of the disk. The rotation speed of the disk, therefore, determines the maximum image acquisition speed.
The parallelization of pinhole scanning not only vastly improves the speed of acquisition. But also using array-based rather than point-based scanning means the system can take advantage of the latest state-of-the-art Scientific CMOS and EMCCD cameras in place of the photomultiplier tube. Such cameras can operate at quantum efficiencies of up to 95%, in contrast to the 10-30% efficiency of the photomultiplier tube of a laser scanning confocal.
Spinning Disk Confocal Microscopy

The spinning disk confocal unit is typically a self-contained module that can be added to the camera port of a microscope. The light source and cameras are then routed through the disk module. A typical setup is illustrated in Figure 4.
The result of this increased speed and sensitivity over laser scanning confocal is a microscopy technique much more suited to the study of live cells, and the dynamic processes which occur within them. Parallel scanning means irradiation of the sample is lower both on average and at peak, which leads to a considerable reduction in damage and photobleaching of the sample.
Image brightness, contrast and quality of optical sectioning can all be optimized through the properties of the disk.
Transmittance
The proportion of incident light that passes through a disk is called the transmittance 𝑇 and is given by the equation below, where 𝐷 is the diameter of pinholes and 𝑆 is the separation distance between them.
T = (D÷S)2
For typical values of 𝐷 = 25𝜇𝑚 and 𝑆 = 250 𝜇𝑚, transmittance is only 1%, meaning the vast majority of light is blocked, both for excitation and emission. For detection, most of the light blocked will originate from out-of-focus planes, however strong illumination and a high sensitivity camera are still vital to achieve an excellent quality image.
Both pinhole diameter and separation are also determining factors of the quality of out-of-focus rejection. Pinhole diameter determines the thickness of the vertical section that can pass through a pinhole – larger pinholes accept a larger optical section. Pinhole separation determines the quality of rejection on longer length scales; out-of-focus light originating sufficiently far from the focal plane can enter neighboring pinholes – a process known as pinhole cross-talk. The extent of cross-talk is sample-dependent, with thick samples most strongly affected. Placing pinholes further apart reduces this effect, at the cost of reducing light transmission through the disk.
Microlenses
The transmittance of the excitation path of a spinning disk setup can be considerably improved with a second disk containing microlenses in the place of pinholes, as illustrated in Figure 5, which focuses illumination light through the pinholes of the primary disk. Transmittance may be improved by an order of magnitude (Inoue and Inoue 2002). This system reduces the light intensity necessary to illuminate a sample, though does not improve the detection of light from the sample.
Axial Resolution: Pinhole Size
The larger the pinhole the more light can pass through, but axial resolution suffers. There are three key parameters that determine the optimal pinhole size to balance these factors:
1. The wavelength of emission from the sample,
2. The numerical aperture,
3. The magnification of the objective.
The optimal pinhole size for a given objective, Dopt, is set as the first minimum of the Airy disk from a point source:
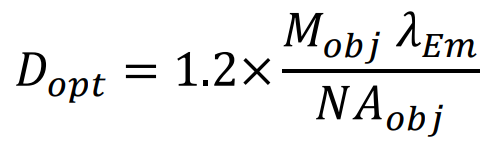
Where Mobj is the objective magnification, NAobj is the numerical aperture of the objective and λEm is the emission wavelength. For example, for GFP emission (λEm = 509 𝑛𝑚), a 60x 1.4NA oil objective would have an optimal pinhole size of 26.2μm. For a 1.4NA 100x objective, the optimal diameter would be 43.6μm. Overlarge pinholes reduce axial resolution. Too small pinholes diffract illumination light excessively, and block emission light unnecessarily, reducing image contrast.
Typically, disk pinholes as supplied by spinning disk unit manufacturers are optimized for either 60x or 100x magnification, oil-immersion objectives. Camera pixel size is therefore important to optimize resolution for the optics of the system.
In the xy plane, resolution is determined by the optical system exactly as it is for a conventional fluorescence microscope, although the increased imaging contrast may mean that in practice, resolvable details are improved. The axial resolution achieved for spinning disk confocal microscopy is typically on the order of 800nm for high-NA objectives. The typical z-step per image depends upon the application – for most imaging, the Nyquist criterion determines the optimal step size just as it is used for determining the optimal pixel size for xy resolution. This specifies a corresponding z-step of 350nm. However, occasionally more clarity and contrast is desired from images, and so deconvolution is performed (see section below). Deconvolution benefits from sub-Nyquist sampling, so smaller z-steps.
The transmittance of the excitation path of a spinning disk setup can be considerably improved with a second disk containing microlenses in the place of pinholes, as illustrated in Figure 5, which focuses illumination light through the pinholes of the primary disk. Transmittance may be improved by an order of magnitude (Inoue and Inoue 2002). This system reduces the light intensity necessary to illuminate a sample, though does not improve the detection of light from the sample.
Pinhole Focus
The transmittance of the excitation path of a spinning disk setup can be considerably improved with a second disk containing microlenses in the place of pinholes, as illustrated in Figure 5, which focuses illumination light through the pinholes of the primary disk. Transmittance may be improved by an order of magnitude (Inoue and Inoue 2002). This system reduces the light intensity necessary to illuminate a sample, though does not improve the detection of light from the sample.
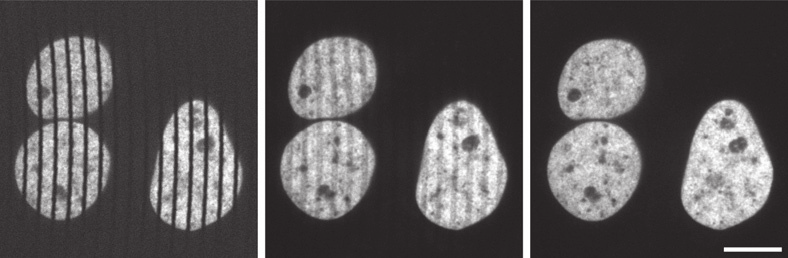
There is one additional focusing step necessary to use a spinning disk microscope: as within the spinning disk unit, the image is formed in the plane of the Nipkow-Petran disk, it is necessary to focus the camera onto this plane to observe the image. Figure 6 demonstrates the image blur introduced when this focus is not achieved. Fortunately, the pinholes provide a clear reference for the correct focal plane. To focus the camera on the plane of the pinholes, it is necessary first to stop the spinning of the disk, then move the camera closer to or further from the disk until the image of the pinholes (insets, Figure 6) has the sharpest edges.
Acquisition Speed
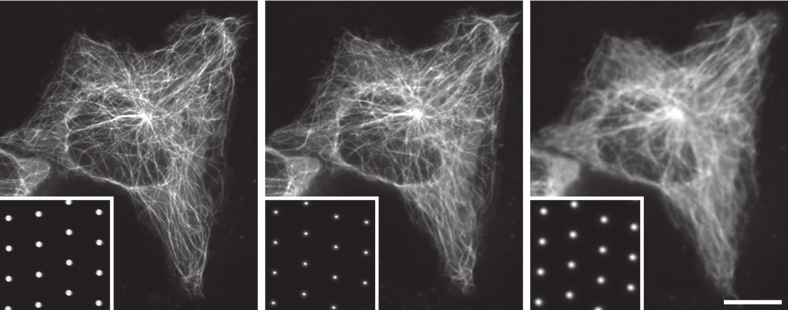
When capturing high-speed dynamic processes or for other applications requiring fine temporal resolution such as calcium imaging, short camera exposure times become necessary. These exposure times can begin to approach the time taken for the disk to scan the image.
The maximum speed of acquisition for spinning disk microscopy is technically determined by how quickly the entire image can be scanned by at least one pinhole, the ‘scan time’, which typically is the time taken for the disk to rotate 30°. If an exposure time less than this scan time is chosen, part of the image is not scanned, and black lines will appear as in the first image of Figure 7. For short exposure times during which only a small number of scans occur, incomplete scans can still present as streaking artefacts as in the center image of Figure 7.
The solution to this problem at high acquisition speed is to synchronize the exposure of the camera to the scanning of the disk, ensuring that the exposure time is equal to a whole number multiple of the scan time. This issue is avoided when using exposure time much longer than the scan time, as small differences in the number of scans are imperceptible (Figure 7, right).
However, in a real microscopy setting, the low transmittance of emission light is required camera exposure time to most likely be the true limit, or especially in the case of CCD-based cameras, the frame time of the camera.
Multichannel Imaging
Multiply-labelled samples imaged in multiple channels simultaneously is possible with spinning disk microscopy, using either single-camera or multiple-camera setups. Multiple illumination wavelengths can be used, and emission can be split with one or a series of dichroic mirrors and filters.
Large sensor cameras are particularly beneficial in single camera multi-channel imaging to allow a large field of view for each channel imaged on the chip.
Deconvolution
When light from a fluorophore passes through the optics of a microscope, diffraction causes the light to spread. The signal captured from light originating from a single point (eg. a single nanometre-scale fluorophore) will take on a characteristic shape known as the Point Spread Function (PSF). Every photon that is detected by the camera has been spread in this characteristic way – mathematically, this is represented by the convolution of the ‘true’ image made up of the physical locations of each fluorophore and the PSF.
As the length scale of this spreading out is given by the resolution of the optical system (which is typically at minimum around 200nm in x and y, and around 800nm in z for spinning disk confocal microscopy), this blurring represents the main barrier to resolving fine details in biological samples.
Deconvolution is the process of reducing the influence of the PSF on the image, through an intensive computational post-processing step.
Deconvolution algorithms have two main forms: deblurring and restorative. Deblurring examines the nearest neighbors of each pixel to determine the blurring of the image, based on a calculated PSF. This is a quick method well-suited to visualisation of data and rendering clear 3-dimensional models for thin samples, but the results are not necessarily quantitative – the results cannot be used to measure or compare intensities.
Restorative deconvolution is more powerful but requires a more accurate understanding of the optical system to form a better approximation to the PSF. This PSF is either measured from imaging sub-diffraction (i.e. <200nm diameter) fluorescent bead, or calculated based on known optical properties of the system. The algorithm then iteratively attempts to guess the original locations of fluorescence without the influence of the PSF. This leads to better image contrast and preserves the relationship between intensities in different parts of the image so some quantitative calculations are possible. Blind deconvolution performs the same process but attempts to derive the PSF from the supplied image. In all cases, the quality of deconvolution depends on the accuracy of the supplied PSF.
Deconvolution can further improve the contrast and quality of optical sectioning of spinning disk microscopy. To maximize the improvement, deconvolution algorithms typically require sub-Nyquist sampling, ie. effective camera pixel sizes and piezo z-steps many times smaller than the resolution of the optical system. For a thorough examination and comparison of the results of deconvolving widefield and confocal images, see (Shaw 2006).
Summary
Spinning disk confocal microscopy overcomes several weaknesses of conventional fluorescence microscopy, including removing out of focus light and using optical sectioning to construct 3-dimensional models from 2- dimensional image slices.
This is achieved by the addition of pinholes which reject light from outside the focal plane. Multiple pinholes are used in spinning disk confocal microscopy to parallelize the process, increasing acquisition speed and making the technique highly suitable for high speed, 3-dimensional imaging of live cells. Deconvolution is often performed following image acquisition to further improve the contrast and quality of optical sectioning.
Spinning disk microscopy is, however, a light rejection technique so a high photon budget is preferred for high-quality imaging. This makes hardware selection extremely important to ensure that as many photons are collected as possible. A sensitive camera is one of the best ways to improve photon collection and EMCCD cameras have historically been preferred for this but many researchers are now moving towards back-illuminated CMOS devices which offer comparable sensitivity to EMCCD cameras but with larger fields of view and increased imaging speeds.
References
Graf, R, J Rietdorf, and T Zimmermann. 2005. “Live Cell Spinning Disk Microscopy.” Adv Biochem Engin/Biotechnol 95: 57-75.
Inoue, S, and T Inoue. 2002. “Direct-VIew High-Speed Confocal Scanner: The CSU-10.” Methods Cell Biology 70.
Jonkman, J, and C M Brown. 2015. “Any Way You Slice It – A Comparison of Confocal Microscopy Techniques.” Journal of Biomolecular Techniques 26: 54-65.
Shaw, P J. 2006. “Comparison of Widefield / Deconvolution and Confocal Microscopy for Three-Dimensional Imaging.” In Handbook of Biological Confocal Microscopy, by J B Pawley, 453. New York: Springer.
Stehbens, S, H Pemble, L Murrow, and T Wittmann. 2012. “Imaging intracellular protein dynamics by spinning disk confocal microscopy.” Nature Methods Enzymology 504: 293-313.