
Introduction
Calcium (Ca2+) is one of the most relevant ions in the body as it is essential for e.g. the accurate timing and function of interneuronal communication or cardiomyocytes. In a physiological system, intracellular and extracellular Ca2+ concentrations ([Ca2+]) are usually not in equilibrium and the concentration gradient is maintained by the cell with a very complex system of ion channels and transporters. Furthermore, the Ca2+ signals can vary dramatically depending on the localization within a cell, e.g. the cytosol, within mitochondria or the endoplasmic reticulum. The global, cytosolic Ca2+ signal in a neuron is in the ballpark of 100 nM, whereas it is in the high μM range just behind an open voltage-gated Ca2+ channel when Ca2+ flows into the cell following the gradient. The importance of Ca2+ in physiological systems makes it a very active area of research and it is crucial to be able to monitor Ca2+ dynamics in a reliable manner. Therefore, the choice of calcium indicator is an important consideration.
With regards to Ca2+ indicators, each variant and sub-type of indicator has only a certain dynamic range for its optimal Ca2+ sensitivity – high-affinity indicators will saturate at too high concentrations and low-affinity indicators will not show a signal at too low concentrations. As a consequence, the indicator needs to be matched to the scientific question.
Ca2+ Chelators
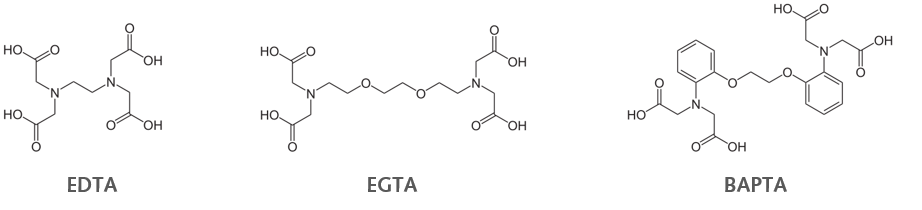
Fluorescent Ca2+ indicator dyes are mainly based on Ca2+ chelators. The classical Ca2+ chelators EDTA (Ethylenediaminetetraacetic acid) and EGTA (ethylene glycol-bis(β-aminoethyl ether)-N,N,N’,N’-tetraacetic acid) are quite slow in binding and releasing the bound Ca2+. As desired binding kinetics should be as fast as possible, those two are sub-optimal for fast physiological conditions/experiments. The better option is BAPTA (bis(2-aminophenoxy)ethane tetraacetic acid; dissociation constant (Kd) = 0.2 μM) because BAPTA has a higher affinity for Ca2+, faster kinetics of binding and release, and most importantly a higher selectivity for Ca2+ over unwanted Mg2+.
Most of those indicators can be purchased as cell-impermeable and cell-permeable variants. To make optimal use of cell-impermeable indicators, they need to be injected/perfused into an individual cell – e.g. via a patch pipette. The cell-permeable version is created by masking the carboxyl groups of the chelator as acetoxymethyl (AM) ester, which renders the molecule lipophilic and allows it to cross the lipid bilayer of the plasma membrane. Once in the cell, cellular esterases will remove the ester bond, free the carboxy groups and allow the indicator to bind Ca2+ ions.
As Ca2+ chelators bind Ca2+ from the surrounding medium – be it to buffer or as an indicator – it will alter the Ca2+ equilibrium. This, in turn, will turn on compensatory mechanisms and potentially lead to artefacts which could be interpreted as scientifically relevant. To avoid this kind of negative side-effect, it is recommended to use the chelating compound at the lowest possible concentration.
Two classes of fluorescent Ca2+ indicator dyes exist, non-ratiometric and ratiometric. Upon Ca2+ binding, two processes can occur based on which indicator type is used. With non-ratiometric dyes, the quantum yield of fluorescence will increase and with ratiometric dyes, the excitation/emission characteristics of the dye will change. Both are discussed below.
Non-Ratiometric Ca2+ Indicator Dyes
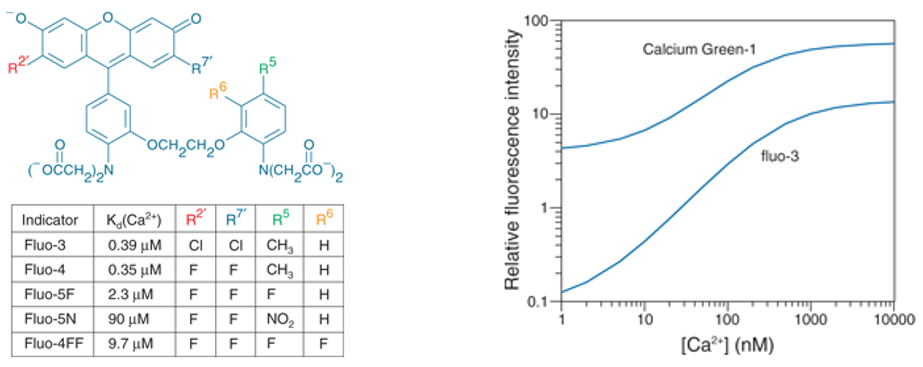
Non-ratiometric dyes are Ca2+ indicators that show a large increase in intensity upon binding to Ca2+, which means the relative change in fluorescence intensity is indicative of a change in [Ca2+].
Non-ratiometric dyes are mainly used for qualitative imaging. It is rather complicated to obtain a definite [Ca2+] because the cell needs to be permeabilized after an experiment and quickly depleted of its Ca2+ to obtain a 0-value, followed by a wash with very high [Ca2+] to measure the indicator under saturating conditions. The relative obtained signal can then be converted into a roughly quantitative signal which comes with a degree of uncertainty. The problem with non-ratiometric dyes is that factors such as acquisition conditions, probe concentration and optical path length can contribute to fluorescence intensity and are not related to [Ca2+].
Non-ratiometric indicators can be imaged using the visual part of the spectrum. For example, Fluo dyes and Oregon-Greens are excited at around 488 nm with an emission above 520 nm. To further reduce the UV/blue component and the accompanying side-effects, Rhod dyes were developed, with Rhod-2 being excited at 540 nm and an emission above 580 nm. Even further to the red X-rhod-1 can be found (ex 550 nm/em 600 nm).
The Ca2+ affinity of the indicators can be changed by modification of the intra-molecular structure. This enables scientists to match the indicator optimally to the required purpose (Figure 2).
Ratiometric Ca2+ Indicator Dyes
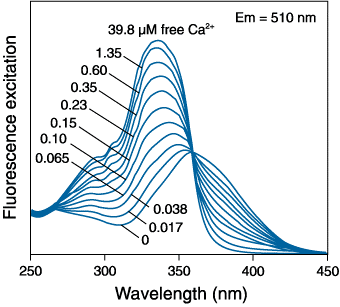
Ratiometric indicators show a dramatic change in their excitation/emission characteristics upon Ca2+ binding. This can be seen in Figure 3 where Fura-2 is excited at ~360 nm with no bound Ca2+ but in the presence of Ca2+, it is excited at ~335 nm. In this way, the spectrum consists of two peaks separated by what is called the isosbestic point. The peak of shorter wavelength on the left increases in absorption with increasing [Ca2+], whereas the peak of longer wavelength on the right has a decreased absorbance.
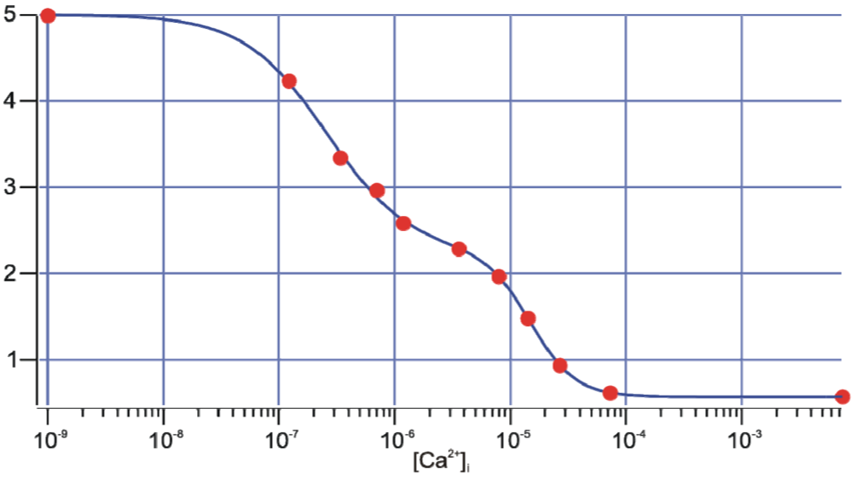
Data is obtained by alternating excitation between both peaks, acquiring the results of both and taking the ratio of the measurements. Obtained ratios can then be backcalculated using a calibration curve which was produced by using various fixed and known [Ca2+] to measure the ratio in vitro or in vivo (Figure 4).
The advantage of ratiometric dyes is that it renders the measurement dye-concentration independent. It is also unaffected by conditions such as illumination intensity, probe loading, bleaching or optical path length.
The drawbacks of ratiometric dyes are that it can be more difficult to manipulate the data due to the use of fluorescence ratios. Furthermore, most ratiometric indicators must be imaged by exciting at below 400 nm. In comparison to the non-ratiometric variants, irradiating cells with UV/near-UV wavelengths might lead to the production of reactive oxygen species (ROS). Those highly reactive oxygen molecules can lead to – at least in mid- and long-term measurements – non-physiological effects such as triggering cell-death (apoptosis).
Transgenic Ca2+ Indicators
The final type of Ca2+ indicator does not rely on indicator dyes but is instead genetically-encoded. Genetically-encoded Ca2+ indicators – or GECIs – are a brilliant tool to monitor Ca2+ in live, transgenic animals. GECIs can be targeted to specific tissues such as neuronal cells, cardiomyocytes, T-cells etc. and circumvent many of the problems associated with indicator dyes.
The expression of GECIs can be tightly controlled by inducing the expression through a tetracycline-inducible system for example. With this approach, measurements will be more representative of physiological conditions as the animal needs no additional Ca2+ buffer in the system.
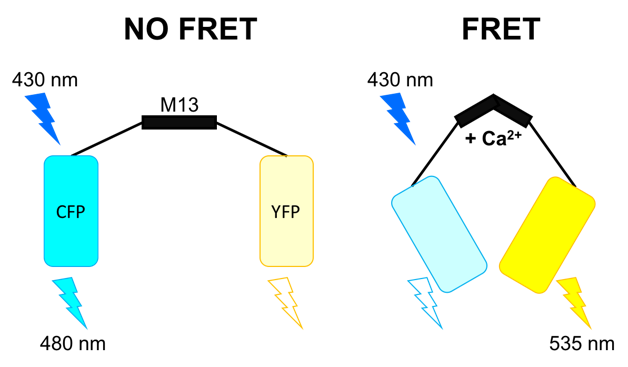
One of the first genetically encoded Ca2+ sensors, cameleon (Figure 5), was published in 1997. It consists of a fusion construct of:
• A cyan-emitting mutant (CFP) of the green fluorescent protein (GFP)
• Calmodulin
• The Ca2+-binding peptide M13, derived from a myosin light chain kinase
• A yellow-emitting mutant (YFP) of GFP
This construct undergoes a conformational change upon binding of 4 Ca2+ ions. This process brings the two fluorescent proteins in close proximity and increases fluorescence resonance energy transfer (FRET), where excitation of the CFP as the electron donor will lead to an increased emission of the YFP (acceptor). The beauty of this approach is that for the first time, an indicator could be targeted to specific intracellular compartments and components such as the nucleus, endoplasmatic reticulum, mitochondria or vesicles for example.
In 2000 the next big step was to modify GFP itself by circular permutation and fusion with Calmodulin and the M13 domain to create the first GCaMP. Binding of Ca2+ leads to a conformational change and the barely fluorescent structure (under no Ca2+ conditions) will increase the intensity of the emission dramatically.
Although the GCaMPs lost the FRET capability, the benefit of this approach is that it freed up an imaging channel to image further structures of interest in parallel to the Ca2+ signal. GCaMPs have since undergone various iterations to make the reporter brighter and faster. Furthermore, a red fluorescent version, RCaMP, has also been published, which allows researchers to avoid UV/near-UV excitation and therefore minimize any unwanted side-effects.
Imaging Ca2+ Sensors
The plethora of Ca2+ indicators that are available nowadays enable researchers to pick the optimal one for their purpose, considering the required Ca2+ sensitivity, fluorescent properties and speed. However, two points they all have in common are the need for speed (in terms of acquisition) and the requirement to use as little excitation light as possible to avoid bleaching and accompanying side-effects.
Applications range from imaging neurons and neuroendocrine cells to imaging Ca2+ sparks in cardiomyocytes. As much as the applications vary, the required frame rates vary: between 0.1 Hz to 1 kHz can be necessary.
Care must be taken to not use too much power, especially when using blue light to excite the indicator, as this can potentially hamper the results of live cell imaging due to the production of phototoxic side products such as reactive oxygen species (ROS). In hand with being able to detect the lowest light levels, sensitivity over a large bandwidth is required to accommodate for different dyes and their corresponding spectral emission properties (ranging from near- UV to far-red).
Furthermore, the field of view of a camera can be relevant depending on the research question. A large field of view is of importance when investigating the behavior of an organotypic brain slice expressing GECIs in neurons for example or in the case where the researcher wants to have a readout of the Ca2+ signal across axons and dendrites. But when imaging an individual cell on a patch clamp system, which usually uses low magnification and low numerical aperture lenses, a smaller field of view is acceptable.
Resolution is mostly sacrificed as speed is more relevant. In the past, EMCCDs were used due to high sensitivity, QE and speed. Nowadays, scientific CMOS cameras are more popular for the combination of fairly high sensitivity and a much higher speed. However, for samples where neither of the two main features, speed and sensitivity, are relevant, CCD cameras can often be more than sufficient.
References
Akerboom, J. et al. (2013) Genetically encoded calcium indicators for multi-color neural activity imaging and combination with optogenetics. Front Mol Neurosci. Mar 4;6:2. doi: 10.3389/fnmol.2013.00002
Grienberger, C. & Konnerth, A. (2012). Imaging Calcium in Neurons. Neuron Mar 8;73(5):862-85. doi: 10.1016/j.neuron.2012.02.011
Grynkiewicz, G., Poenie, M., and Tsien, R.Y. (1985). A new generation of Ca2+ indicators with greatly improved fluorescence properties. J. Biol. Chem. 260, 3440–3450.
Heindorf, M. & Hasan, M. T. (2015) Fluorescent Calcium Indicator Protein Expression in the Brain Using Tetracycline- Responsive Transgenic Mice. Cold Spring Harb Protoc. Jul 1;2015(7):689-96. doi: 10.1101/pdb.prot087627
Miyawaki, A. et al. (1997) Fluorescent indicators for Ca2+ based on green fluorescent proteins and calmodulin. Nature. Aug 28;388(6645):882-7
Mulkey, R. M. & Zucker, R. S. (1991). Action potentials must admit calcium to evoke transmitter release) Nature 350, 153– 155, doi:10.1038/350153a0
Pasche, M. (2009) Gleichzeitige Beobachtung der Exozytose in Chromaffinzellen mit einer Kombination von Interner Totalreflektions-Fluoreszenz-Mikroskopie und Membrankapazitätsmessung. Doctoral thesis. http://dx.doi.org/10.22028/D291-21244