
Introduction
Fluorescence microscopy is a workhorse technique in biological sciences allowing specific biological structures to be labeled and imaged with high contrast. Single molecule imaging represents a subset of fluorescence microscopy techniques that uses fluorescent tags to detect and analyze individual single molecules. This allows the activity of single molecules to be visualized with high signal-to-noise without disturbing the physiological conditions of the biological system.
In this application note, we discuss why single molecule imaging would be used over other microscopy techniques and explore some of the main techniques and applications for it, including recent discoveries and future perspectives.
Why Detect Single Molecules?
Classical biological techniques focused on describing the behavior of large ensembles of molecules. This has advantages when looking at the behavior of homogenous samples containing large numbers of the same molecules or cells because any individuals in the population displaying anomalous behaviors get ‘averaged out’. This results in a reasonably representative model of behavior.
However, this method doesn’t allow for the identification of subpopulations within the ensemble. It’s important to note that a supposedly homogenous sample population can never be truly homogeneous, even a population of genetically identical molecules will have variation due to environmental factors or the age of the molecule for example. Ensemble studies can’t show how single molecules or subpopulations behave under differing experimental conditions. The behavior of a cell in an early or late phase in the cell cycle may have vastly different behaviors to the ‘ensemble average’.
Therefore, the only way to investigate the behavior of single molecules or subpopulations is under strict experimental conditions, guaranteeing that each molecule is in the same state, one at a time.
The follow-up consideration is the type of fluorophore to use. Generally speaking, fluorophores for single molecule imaging should be: Bright (high extinction coefficient and high quantum yield) to maximize signal, photostable (do not photobleach quickly) to allow the fluorophore to be imaged for long periods, small enough to not disrupt the biological activity of the labeled molecule and emit light in the visible region of the spectrum, preferably where the scientific camera has the highest quantum efficiency.
There is a vast amount of choice when it comes to fluorophore selection, all of which have their advantages and disadvantages based on the criteria above. The most popular of which would be organic dyes (eg. FITC, TRITC), fluorescent proteins (eg. GFP, YFP) and quantum dots. A full discussion of fluorophores can also be found in the Photometrics Application Note: Labelling Proteins for Single Molecule Imaging.
The selection of a labeling method and fluorophore is vitally important and needs to be carefully balanced against the needs of the sample and specific imaging technique. One of the most important factors affecting single molecule imaging quality is detecting the low signal coming from a single fluorophore in what is likely a high background noise environment. Furthermore, it’s often necessary to image at high framerates which means using low exposure times, further pushing the sample into a low signal-to-noise environment. Single molecule imaging is, therefore, a technique that greatly benefits from a highly sensitive, high-speed scientific camera.
Single Molecule Fluorescence Techniques
Single molecule methods largely fall into two categories: observing single molecule behavior in a system or observing single molecule behavior under applied force. In the first category, the behavior of labeled single molecules in a system of interest is typically observed using standard fluorescence microscopy techniques whereas in the second category the mechanical response of single molecules is investigated by applying a tension or torsion. Force is typically applied to a single molecule using atomic force microscopy (AFM), optical tweezers (OT) or magnetic tweezers (MT) and this provides incredible insight into the biophysics of the molecule. For more details about optical tweezers and capturing this kind of biophysical data, see the Photometrics Application Note on Optical Tweezers.
The remaining single molecule methods can be divided into widefield fluorescence, confocal, TIRF, FRET, FRAP and PALM/STORM.
Widefield Fluorescence Microscopy
The greatest advantage of using widefield microscopy for single molecule imaging is the ability to visualize hundreds of molecules simultaneously. This allows for the observation of large numbers of single molecule interactions, allowing the researcher to easily collect a large amount of data for analysis. It also increases the likelihood of detecting rare events.
This technique was used in one of the first published examples of single-molecule fluorescence microscopy (Rotman, 1961) where the fluorescent products of an enzyme-catalyzed reaction could be used to identify individual molecules of the enzyme.
The downside of widefield microscopy is that stray signals from above and below the focal plane can interfere with the visualization of the molecules of interest by introducing substantial background fluorescence, lowering the effective signal-to-noise ratio as exemplified by Fig.1. This is particularly problematic for single molecule imaging because the amount of signal originating from a single fluorophore is already so low.

Confocal Microscopy
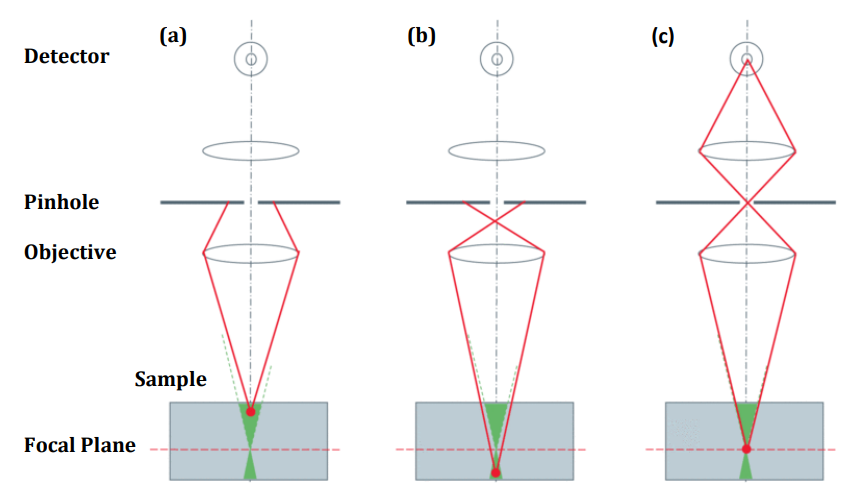
The problems of widefield fluorescence microscopy can be mostly overcome by using confocal microscopy. In confocal microscopy, out-of-focus background fluorescence is removed with a pinhole. Essentially, the pinhole rejects emitted light from above and below the focal plane, allowing only the light from the focal plane to reach the camera. The result is the ability to perform optical sectioning, to only image the plane of interest (Fig.2).
Aside from the benefit of removing background fluorescence, using confocal microscopy opens up more areas of research because, by visualizing only one focal plane, single molecules immobilized on the coverslip surface or cell surface, for example, can be specifically detected. This has been successfully used in the past to investigate areas such as DNA repair where single molecule confocal imaging allowed direct observation of the binding of nucleotide excision repair (NER) proteins to DNA (Segers-Nolten et al. 2002).
More recent studies have used a confocal microscope to create a ‘confocal excitation volume’, effectively a 3D focused laser spot on the sample, which isn’t used for detection but as a light source to excite fluorescently tagged molecules. The excited molecules are then detected using other techniques (Shashkova & Leake, 2017).
TIRF
Total internal reflection fluorescence (TIRF) microscopy can be described as an optical sectioning technique. However, unlike confocal microscopy which rejects out-of-focus fluorescence using a pinhole, TIRF takes advantage of the reflection of light to image a small area just above the coverslip.
In TIRF, the excitation laser is angled in such a way that it completely reflects off of the glass sample slide. The result is that all light is reflected, and no light penetrates into the sample. However, in the area where light is reflected, an evanescent wave is formed on the other side of the slide that creates very shallow illumination into the sample. The evanescent wave oscillates with the same frequency of the reflected light, so it still excites any fluorescent molecules within this small area. The area of the evanescent wave is dictated by the optics used but typically a ~100 nm optical section is created at the surface (Fig.3).

The advantage of TIRF for single-molecule fluorescence is that no out-of-focus signal is collected so the only fluorescence emission detected comes from the area of the evanescent wave. The signal-to-noise ratio is thereby significantly improved (Fig.1). TIRF is therefore particularly useful for studying areas of the sample close to the surface such as molecules immobilized on a coverslip or on the surface of cell membranes. TIRF is one of the most frequently used imaging methods in single-molecule fluorescence microscopy, being used for applications such as actin and myosin transport dynamics (Zimmerman et al. 2015) and molecular diffusion (Fujiwara et al. 2016). To find out more about TIRF and its range of different modalities and applications see the Photometrics Application Note on TIRF.
FRET
Förster resonance energy transfer (FRET) is a single molecule method used to determine whether two fluorophores are within a certain distance of one another. Proposed by Theodor Förster in 1960 and confirmed experimentally by Stryer & Haugland (1967), FRET takes advantage of the principle of non-radiative energy transfer between a donor and acceptor molecule to determine the proximity of the two molecules.
The mechanism of FRET uses a fluorescent donor molecule in an excited state to transfer energy to a fluorescent acceptor molecule through electronic resonance of molecular orbitals without emitting a photon (Hussain, 2012). In effect, energy is transferred from one molecule to the other which can be detected as a decrease in fluorescence of the donor molecule and an increase in fluorescence of the acceptor molecule. Energy transfer can only occur when the molecules are sufficiently close to each other, typically in the range of 1-10 nm. Therefore, the rate of FRET can be used to determine whether two molecules are separated within this distance range.
This mechanism has led to FRET being used as a ‘spectroscopic ruler’. In experiments that affect the distance separating the donor and acceptor molecules, the FRET rate will also be affected. The FRET rate is directly proportional to the distance separating the two molecules, which allows this distance to be quantified until the molecules reach a separation distance where FRET no longer occurs.
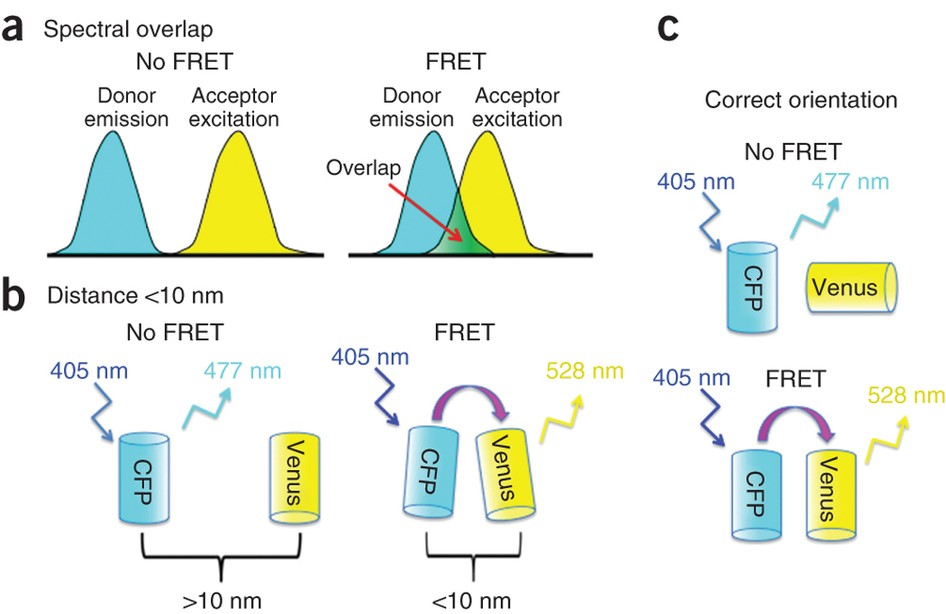
Aside from the condition that the two molecules be within ~10 nm of one another for FRET to work (Fig.4B), there are other criteria that must also be satisfied. Mainly, (1) the emission spectrum of the donor molecule must overlap with the excitation spectrum of the acceptor molecule (Fig.4A), (2) the orientation of the transition dipoles must be parallel to each other (Fig.4C) and (3) the fluorescence lifetime of the donor molecule must be long enough for FRET to occur.
The distance information gathered from single molecule FRET makes it an ideal technique for applications investigating the structure and dynamics of proteins and nucleic acids. Recent publications in these areas include visualizing conformational changes in proteins such as enzymes during their functional cycle (Dyla et al. 2016) and monitoring DNA synthesis in real-time (Fijen et al. 2017).
FRAP
Fluorescence recovery after photobleaching (FRAP) is a single molecule technique where a specific area of a cell or tissue is selectively photobleached so that recovery of fluorescence to that area can be observed (Fig.5).

Adapted from Shashkova & Leake (2017)
It was developed by Axelrod et al. (1976) as a method to study protein mobility in living cells and has since grown to become a popular technique for investigating molecular transport events such as diffusion as well as protein dynamics and interactions with other cellular components.
FRAP is typically performed by irreversibly photobleaching an area of the cell with high-intensity laser illumination. These fluorophores are rendered incapable of photon emission so the recovery of fluorescence in that area can only come from other fluorescent molecules moving into it. The speed of movement of molecules into the bleached area is directly proportional to the speed of diffusion which gives information about the mobility of the labeled molecules (Ishikawa-Ankerhold et al. 2012).
FRAP continues to be used for protein mobility and molecular diffusion studies but has also evolved to include applications such as binding dynamics (Groeneweg et al. 2014) as well as being used in combination with single molecule tracking (Tran-Ba et al. 2015).
PALM/STORM
The diffraction limit of light restricts the resolution of conventional fluorescence microscopy techniques to ~200 nm laterally and ~500 nm axially. However, many molecules and structures of interest require a higher degree of resolution than the diffraction limit of light allows.
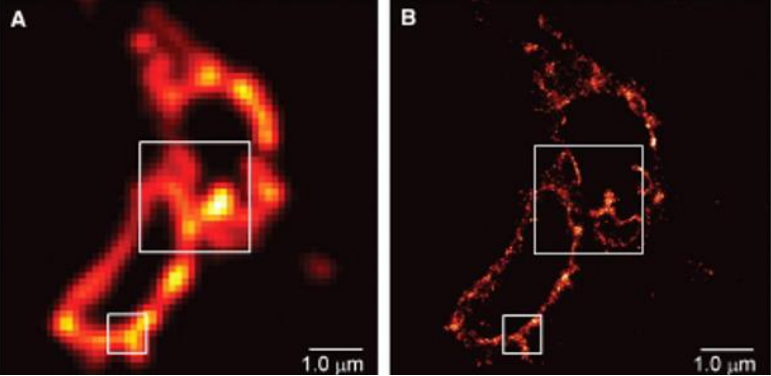
To visualize molecules beyond the diffraction limit, a family of super-resolution techniques was developed that includes Photoactivated Localization Microscopy (PALM) and Stochastic Optical Resolution Microscopy (STORM). These techniques are able to temporally isolate single molecules from a group and take advantage of our ability to localize individual fluorophores to sub-diffraction-limited spots. By individually localizing single fluorophores and putting them together again to reconstruct them into one image, it is possible to generate a super-resolved image that effectively breaks the diffraction limit of light (Fig.6).
PA-FP Kaede. Adapted from Betzig et al. (2006)
To learn more about PALM/STORM and the mechanisms of super-resolution localization microscopy, see the Photometrics Application Note on Super-Resolution Localization Microscopy which covers these topics in far greater detail.
Cameras For Single-Molecule Imaging
One of the biggest weaknesses of single-molecule imaging is that experiments are often performed in a low signal-to-noise environment. This is due to the inherent difficulty of imaging a single fluorophore which will be many times dimmer than visualizing an ensemble of fluorophores coupled with some applications requiring a high speed which means low exposure times.
For this reason, single-molecule imaging typically requires scientific camera technology that is pushing the boundaries in high sensitivity, low noise, high speed and large fields of view. Historically, EMCCD cameras have been the technology of choice as they are back-illuminated with 95% quantum efficiency, have extremely low noise characteristics with reasonable speed and field of view. However, new back-illuminated CMOS cameras with 95% quantum efficiency, faster speeds and larger fields of view than EMCCDs have started to become the preferred technology for many single-molecule applications.
High resolution may also be a concern for some single-molecule applications which means that matching objective resolution to the pixel size of the camera is also important. In this case, it is vital to balance the high sensitivity of a larger pixel with the resolution requirements of the application. For Nyquist sampling, a 10-11 µm pixel is optimized for 100x magnification whereas a 6-7 µm pixel is optimized for 60x magnification. Larger pixels often used on EMCCD cameras are typically 13 µm or 16 µm which would need 120x or 150x magnification respectively. This should also be balanced with the field of view requirement as higher magnification means less visible sample area.
Summary
Single-molecule imaging is used to investigate the biological structure and function of individual molecules. Compared to ensemble studies, single-molecule imaging reveals far more information about the behavior of molecules that would otherwise be hidden by ensemble averaging. This has resulted in a wealth of new information over a large range of biological processes.
Since the uptake of single-molecule imaging in the 1990s, many new techniques have since been developed and embraced by single-molecule researchers. With the development of newer, brighter fluorophores and more sensitive scientific cameras, the historical issues of low signal-to-noise in single-molecule experiments are becoming less of a limiting factor. This has led to single-molecule imaging becoming more and more popular as a fluorescence microscopy technique.
Download As PDF
References
Ishikawa-Ankerhold, H. C., Ankerhold, R. & Drummen, G. P. (2012) Advanced fluorescence microscopy techniques– FRAP, FLIP, FLAP, FRET and FLIM. Molecules. Apr 2;17(4):4047-132. doi: 10.3390/molecules17044047
Shashkova, S. & Leake, M. C. (2017) Single-molecule fluorescence microscopy review: shedding new light on old problems. Biosci Rep. Jul 21;37(4). pii: BSR20170031. doi: 10.1042/BSR20170031
Axelrod, D., Koppel, D. E., Schlessinger, J., Elson, E. & Webb, W. W. (1976) Mobility measurement by analysis of fluorescence photobleaching recovery kinetics. Biophys J. 1976 Sep;16(9):1055-69.
Brooks Shera, E., Seitzinger, N. K., Davis, L. M., Keller, R. A. & Soper, S. A. (1990) Detection of single fluorescent molecules. Chemical Physics Letters. Volume 174, Issue 6, 23 November, Pages 553-557
Broussard, J. A., Rappaz, B., Webb, D. J. & Brown, C. M. (2013) Fluorescence resonance energy transfer microscopy as demonstrated by measuring the activation of the serine/threonine kinase Akt. Nat Protoc. Feb;8(2):265-81. doi: 10.1038/nprot.2012.147
Dyla, M., Andersen, J. L., Kjaergaard, M., Birkedal, V., Terry, D. S., Altman, R. B., Blanchard, S. C., Nissen, P. & Knudsen, C. R. (2016) Engineering a Prototypic P-type ATPase Listeria monocytogenes Ca(2+)-ATPase 1 for Single-Molecule FRET Studies. Bioconjug Chem. Sep 21;27(9):2176-87. doi: 10.1021/acs.bioconjchem.6b00387
Fijen, C., Montón Silva, A., Hochkoeppler, A. & Hohlbein, J. (2017) A single-molecule FRET sensor for monitoring DNA synthesis in real time. Phys Chem Chem Phys. Feb 8;19(6):4222-4230. doi: 10.1039/c6cp05919h.
Förster, T. (1960) Transfer Mechanisms of Electronic Excitation Energy. Radiation Research Supplement. Vol. 2, October 12-16, pp. 326-339 DOI: 10.2307/3583604
Fujiwara, T. K., Iwasawa, K., Kalay, Z., Tsunoyama, T. A., Watanabe, Y., Umemura, Y. M., Murakoshi, H., Suzuki, K. G., Nemoto, Y. L., Morone, N. & Kusumi, A. (2016) Confined diffusion of transmembrane proteins and lipids induced by the same actin meshwork lining the plasma membrane. Mol Biol Cell. Apr 1;27(7):1101-19. doi: 10.1091/mbc.E15-04- 0186
Groeneweg, F. L., van Royen, M. E., Fenz, S., Keizer, V. I., Geverts, B., Prins, J., de Kloet, E. R., Houtsmuller, A. B., Schmidt, T. S. & Schaaf, M. J. (2014) Quantitation of glucocorticoid receptor DNA-binding dynamics by single-molecule microscopy and FRAP. PLoS One. Mar 14;9(3):e90532. doi: 10.1371/journal.pone.0090532.
Hussain, S. A. (2012) An Introduction to Fluorescence Resonance Energy Transfer (FRET). Science Journal of Physics. Volume 2012, Article ID sjp-268, 4 Pages. doi: 10.7237/sjp/268
Rotman, B. (1961) Measurement of activity of single molecules of beta-D-galactosidase. Proc Natl Acad Sci U S A. Dec 15;47:1981-91.
Segers-Nolten, G. M., Wyman, C., Wijgers, N., Vermeulen, W., Lenferink, A. T., Hoeijmakers, J. H., Greve, J. & Otto, C. (2002) Scanning confocal fluorescence microscopy for single molecule analysis of nucleotide excision repair complexes. Nucleic Acids Res. Nov 1;30(21):4720-7.
Stryer, L. & Haugland, R. P. (1967) Energy transfer: a spectroscopic ruler. Proc Natl Acad Sci U S A. Aug; 58(2): 719–726.
Tran-Ba, K. H., Higgins, D.A. & Ito, T. (2015) Fluorescence Recovery after Photobleaching and Single-Molecule Tracking Measurements of Anisotropic Diffusion within Identical Regions of a Cylinder-Forming Diblock Copolymer Film. Anal Chem. Jun 2;87(11):5802-9. doi: 10.1021/acs.analchem.5b01041.
Yu, J. (2016) Single-Molecule Studies in Live Cells. Annu Rev Phys Chem. May 27;67:565-85. doi: 10.1146/annurevphyschem-040215-112451.
Zimmermann, D., Santos, A., Kovar, D. R., Rock, R. S. (2015) Actin age orchestrates myosin-5 and myosin-6 run lengths. Curr Biol. Aug 3;25(15):2057-62. doi: 10.1016/j.cub.2015.06.033.
Zlatanova, J. & van Holde, K. (2006) Single-molecule biology: what is it and how does it work? Mol Cell. Nov 3;24(3):317-29.