
Introduction
Since the development of super-resolution microscopy, the diffraction limit of light has no longer been the hard limit of resolution, enabling us to resolve incredibly fine sub-cellular details. However, many of the techniques that significantly increase resolution have very specific sample preparation requirements, long acquisition times, or complicated analysis.
Super-resolution optical fluctuation imaging (SOFI) is a computational super-resolution technique that delivers resolution gain for samples containing fluctuating fluorophores. Remarkable for its simplicity, affordability, high speed, and low levels of light exposure, SOFI avoids many of the drawbacks of localization-based super-resolution techniques such as STORM for live cell and fixed cell imaging i.e. lengthy acquisitions, high SNR requirements, and specific blinking needs.
The technique, which is based on the statistical evaluation of the correlation of light produced by fluorophores, was introduced by Dertinger et al. in 2009 and has since shown rapid improvement, including the introduction of the possibility of 3-D and multi-spectral imaging. (Dertinger et al., 2010; Peeters et al., 2017; Descloux et al., 2018; Yi, Son and Weiss, 2018; Grußmayer et al., 2019; Purohit et al., 2019).
Principle of SOFI
The fundamental principle of SOFI is to exploit the correlation of light from individual fluorophores. When the emission of a single fluorophore fluctuates in time, the light from that single fluorophore will be correlated (statistically similar) in time. This occurs no matter where the light from that fluorophore hits the camera, how much light is detected, or whether neighboring fluorophores are also emitting.
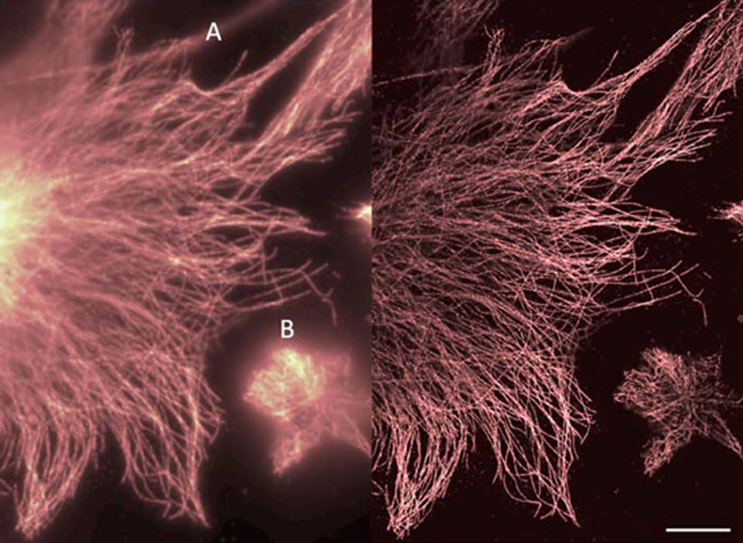
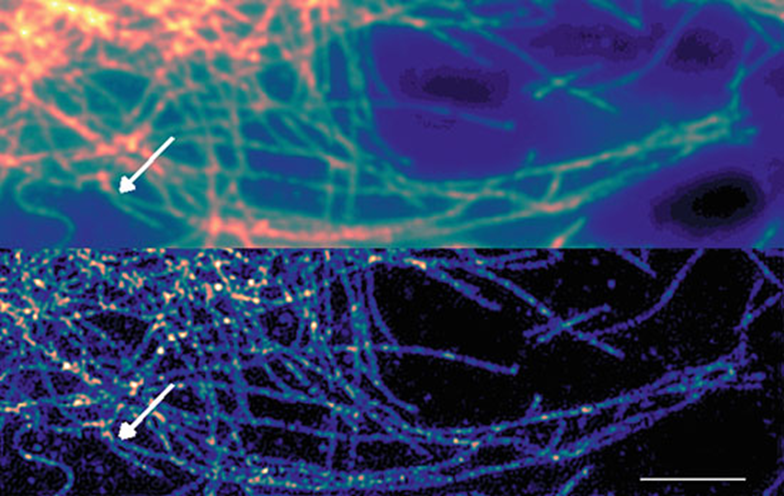
Correlation inherent in the image can be mathematically calculated, and SOFI analysis reveals this correlation in the image. The more light and the more correlated the light that hits a pixel, the brighter that pixel will be in the SOFI image. Uncorrelated sources of signal such as background light and out-of-focus light will be suppressed, this provides enhanced resolution and optical sectioning ability, as demonstrated in Fig.1 and Fig.2.
Additionally, as SOFI is fundamentally a computational technique, it is well suited to use in combination with other computational techniques (Descloux et al., 2018) or super-resolution techniques such as STORM (Schidorsky et al., 2018), SIM (Zhao et al., 2017), and PALM (Deschout et al., 2017). This underlines SOFI’s versatility as a computational tool.
The advantages of SOFI over other super-resolution techniques include its inherent optical sectioning and rejection of out of focus light. This is beneficial for imaging inside samples and generating reconstructed 3D models with relatively few acquired frames, meaning it is a high-speed super-resolution technique with demonstrated temporal resolution as fine as 80 ms (Peeters et al., 2017).
At its simplest, SOFI offers a 1.4 (√2)-fold resolution improvement over widefield imaging, and higher orders can reach up to a 3 to 5-fold improvement. This compares favorably to SIM, which offers 2-fold resolution improvement, though SIM variants such as iSIM are capable of better temporal resolution (York et al., 2013; Curd et al., 2015). In addition, SOFI does not require high signal-to-noise ratio (SNR) images to operate.
SOFI Acquisition
SOFI needs no special sample preparation other than the requirement that the fluorophores have some stochastic time-dependent fluctuation. Such fluctuations are widely seen in the blinking dyes used for STORM imaging, as well as in quantum dots. Therefore, typical fluorophores include quantum dots and any blinking dye used for STORM acquisition such as Alexa 647.
For a single SOFI acquisition, 100s to 1000s of frames are captured. Unlike STORM, the signal from fluorophores can overlap without worsening resolution, but no non-fluctuating signal will be maintained in the SOFI image. Further, the blinking of fluorophores for SOFI can occur on any timescale providing the dark-state lifetimes are of the order of the framerate (Geissbuehler, Dellagiacoma and Lasser, 2011).
The imaging system should be optimized for maximum diffraction-limited resolution as with other super-resolution techniques, and the pixel size requirements are simply that the point spread function (PSF) be spread over more than one pixel, as would be the case at the Nyquist sampling rate. Although drift and movement in the sample must be avoided, the short acquisition times and the relatively small number of frames required mean SOFI acquisition is quite suitable for live-cell imaging, as seen in Figs. 1 and 2.
SOFI Image Analysis
Fundamentally, the process of SOFI analysis is to input a sequence of images of a static sample, and output an image where each pixel shows the degree of correlation (either within that pixel over time, or with its nearest neighbors over time). An open-source computational tool called Localizer has been produced for quick and easy setup of SOFI analysis (Dedecker et al., 2012).
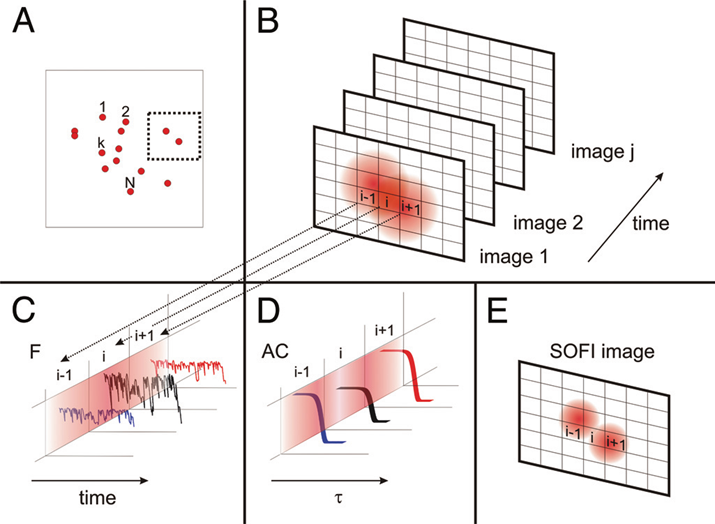
The simplest form of SOFI is 2nd order autocorrelation-SOFI or AC-SOFI, as seen in Fig.3. As seen in Fig.3B, multiple frames in a movie acquisition capture light emitted by fluorophores which are too close together to resolve conventionally as their PSFs overlap. However, the light from each of these fluorophores is correlated in time. If a certain number of photons hit a pixel, the temporal autocorrelation of that pixel will be higher if those photons originated from the same fluorophore. This pixel would have a high value in the SOFI image. A pixel that received photons from many different sources (including out-of-focus light) will show a low correlation, and hence a lower value.
The theory of SOFI considers a fluorescence image as a collection of individual fluorophores, which for the purposes of our imaging are fluctuating over time (e.g. from an ‘on’ state to an ‘off’ state) but are not moving. Mathematically speaking, SOFI gains its resolution advantage through the multiplication of fluorescence with itself in the correlation function. For 2nd order SOFI, the correlation function scales with the PSF^2 rather than the PSF, meaning the PSF is in effect shrunk by a factor of √2 in each dimension.
Higher-Order SOFI Analysis
Conveniently, SOFI resolution improvement can be discretely increased by higher orders of the correlation calculation. For SOFI of order n, AC-SOFI can increase resolution by a factor of √ n. The basic form of SOFI is 2nd order SOFI, and involves correlations between two points in time (autocorrelation SOFI or AC-SOFI) or two points in space (cross-correlation SOFI or XC-SOFI) for the same pixel. In fact, it is possible to examine the correlation of up to n measurements at the same time, which simply extrapolates the idea for the standard two measurements, as seen in Fig.4.
Higher orders introduce more points to the correlation function – however, the calculations for higher orders of correlation include terms for lower orders, which have the effect of lowering the resolution. To overcome this, higher-order cumulants are used instead of correlations, which neglect these lower terms. The mathematical form of these cumulants is described in the Supplementary Information of (Dertinger, Colyer, Iyer, Weiss, & Enderlein, 2009).
Essentially, higher-order SOFI increases resolution, however, they also have the effect of increasing the difference between initially bright and dim areas of the sample, and between highly-fluctuating and weakly-fluctuating sources, so the order choice of SOFI is a trade-off between resolution on the one hand, and a useable image dynamic range on the other (as well as computation time).
Cross-correlation SOFI
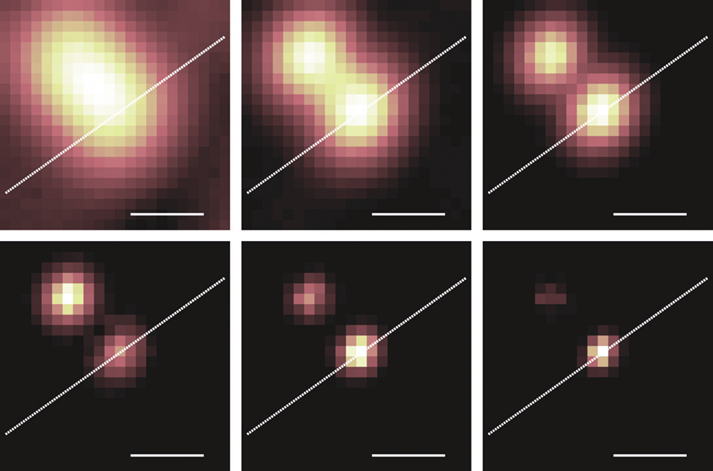
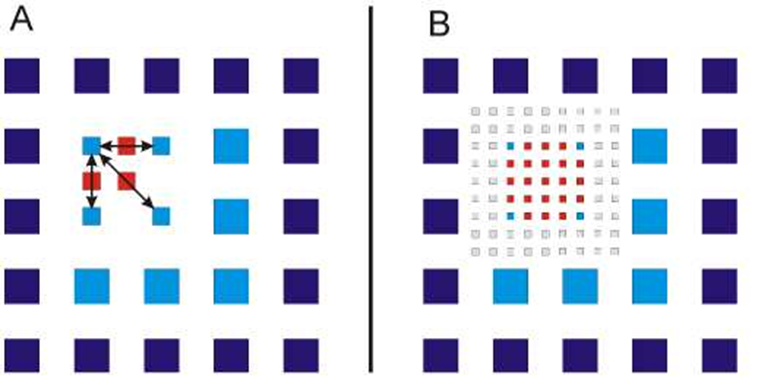
AC-SOFI improves contrast and resolution purely through the autocorrelation in time of individual pixels, preserving the number of pixels in the original image. An extension of the technique called cross-correlating SOFI (XC-SOFI) can be used to generate sub-pixels between the pixels of the original image through cross-correlations between nearby pixels, demonstrated in Fig.5. This increases the amount of information the acquisition can contain and means SOFI is less reliant upon the pixel size of the detector for resolution (Dertinger et al., 2010).
XC-SOFI was introduced around the same time as a technique called Fourier Re-weighting, which bears a resemblance to deconvolution. Using this technique, the contribution of the PSF to the image can be further reduced, meaning the resolution improvement of n-th order XC-SOFI is improved from √ n to n . As there is also an n-fold increase in sub-pixels (both horizontally and vertically), Fourier Re-weighted XC-SOFI is delivering a true resolution increase (Dertinger et al., 2010).
Challenges with SOFI
Drift
A major challenge to SOFI imaging, much like localization-based techniques, is motion in the sample such as drift. If not corrected before SOFI analysis, this would lead to a blurred SOFI image, and can even result in negative values in the image.
Dynamic Range
Higher-order SOFI analysis increases the dynamic range between the brightest and darkest areas of the image, and between areas with a high and low degree of correlation. This can lead to very large differences in grey levels across the sample, meaning different areas and structures can be difficult to view with the same histogram display scale settings. Non-linear mapping of grey levels to displayed brightness or color look-up tables can improve these display issues.
Correlated Noise
SOFI relies on the only source of correlation in the image being the correlated light of single fluorophores. However, it is possible that other sources of correlated signal can be included, such as a 50Hz flicker from room lights, resonances in experimental apparatus, or correlated noise in the camera.
In general, the main sources of camera-related noise in imaging are un-correlated by definition. But some camera technologies have correlated noise in the form of structured fluctuations in space or time across the image. Although minor, these correlations may artificially increase the degree of correlation observed in the image.
3D and Multi-spectral SOFI
Like STORM and other super-resolution methods, SOFI can be adapted for 3D imaging. This can be achieved with axial scanning with a motorized microscope stage. Simultaneous 3D SOFI is also possible; multiple methods have been suggested and implemented, such as multi-plane SOFI, in which a multi-plane prism is used to image up to 8 planes simultaneously at high speed (Descloux et al., 2018).
Alternatively, additional information about fluorescent molecules can be encoded into their PSF, utilizing similar techniques to 3D STORM wherein astigmatism or helicity is introduced which is dependent upon the axial position of molecules. Recently, a general method for accessing PSF / waveform engineering information with SOFI was proposed (Purohit et al., 2019), with a proof of concept measurement of the axial position of quantum dots imaged at a single axial plane. The authors propose that spectral information could be similarly encoded into the PSF, allowing single-image multi-channel acquisitions.
An alternative method for multi-channel SOFI exploits SOFI’s super-resolution mechanism not only in spatial dimensions but also spectrally (Grussmayer et al., 2019). Beginning with two spectrally separated wavelength channels, a third fluorophore is introduced which deliberately introduces cross-talk between the two channels. Using the correlation information between wavelength channels, the molecules of each of the three channels can be separated with a high degree of accuracy, as demonstrated in Fig.6.

Cameras for SOFI
SOFI is a high-speed, super-resolution technique and would, therefore, pair best with a high-speed camera with small pixels or pixels optimized for Nyquist at certain magnifications. The fastest cameras with the smallest pixels are typically sCMOS cameras, which can run at 100s of frames per second and can synchronize to light sources through triggering, further increasing SOFI experimental efficiency. Depending on the final resolution, camera pixel size can also be matched to Nyquist to ensure that detectors are not undersampling on SOFI samples.
Summary
SOFI offers versatile, high-speed, and low-cost computational super-resolution imaging of samples with fluctuating fluorophores. Through the choice of the order of SOFI analysis used, the extent of the resolution increase can be tuned. More advanced techniques such as Fourier-reweighting cross-correlating SOFI can further yield additional image pixels of information with a corresponding reduction in the size of the PSF. With less demanding equipment requirements than techniques such as SIM, and less sample and SNR requirements than STORM, SOFI is a valuable tool in super-resolution imaging.
References
Curd, A. et al. (2015) ‘Construction of an instant structured illumination microscope’, Methods. Elsevier Inc., 88, pp. 37–47. doi: 10.1016/j.ymeth.2015.07.012.
Dedecker, P. et al. (2012) ‘Localizer: fast, accurate, open-source, and modular software package for superresolution microscopy.’, Journal of Biomedical Optics, 17(12), p. 126008. doi: 10.1117/1.JBO.17.12.126008.
Dertinger, T. et al. (2009) ‘Fast, background-free, 3D super-resolution optical fluctuation imaging (SOFI)’, Proceedings of the National Academy of Sciences of the United States of America, 106(52), pp. 22287–92. doi: 10.1073/pnas.0907866106.
Dertinger, T. et al. (2010) ‘Achieving increased resolution and more pixels with Superresolution Optical Fluctuation Imaging (SOFI)’, Optics Express, 18(18), p. 18875. doi: 10.1364/OE.18.018875.
Deschout, H. et al. (2017) ‘Combining PALM and SOFI for quantitative imaging of focal adhesions in living cells’, 10071, p. 100710E. doi: 10.1117/12.2252865.
Descloux, A. et al. (2018) ‘Combined multi-plane phase retrieval and super-resolution optical fluctuation imaging for 4D cell microscopy’, Nature Photonics. Springer US, 12(3), pp. 165–172. doi: 10.1038/s41566-018-0109-4.
Geissbuehler, S., Dellagiacoma, C. and Lasser, T. (2011) ‘Comparison between SOFI and STORM’, 2(3), pp. 810–813.
Grussmayer, K. S. et al. (2019) ‘Spectral Cross-Cumulants for Multicolor Super-resolved SOFI Imaging’, arXiv preprint, (arXiv:1907.07007), pp. 1–43.
Peeters, Y. et al. (2017) ‘Correcting for photodestruction in super-resolution optical fluctuation imaging’, pp. 1–10. doi: 10.1038/s41598-017-09666-4.
Purohit, A. et al. (2019) ‘Spatio-temporal correlation super-resolution optical fluctuation imaging’, Epl, 125(2). doi: 10.1209/0295-5075/125/20005.
Schidorsky, S. et al. (2018) ‘Synergizing superresolution optical fluctuation imaging with single molecule localization microscopy’, Methods and Applications in Fluorescence, 6(4), p. 45008. Available at: http://stacks.iop.org/2050-6120/6/i=4/a=045008.
Yi, X., Son, S. and Weiss, S. (2018) ‘Fast Super Resolved Imaging of Live Cells Using Superresolution Optical Fluctuation Imaging 2.0 (SOFI-2.0)’, Biophysical Journal. Elsevier, 114(3), pp. 13a–14a. doi: 10.1016/j.bpj.2017.11.118.
York, A. G. et al. (2013) ‘Instant super-resolution imaging in live cells and embryos via analog image processing’, Nature Methods, 10(11), pp. 1122–1126. doi: 10.1038/nmeth.2687.
Zhao, G. et al. (2017) ‘Resolution-enhanced SOFI via structured illumination’, Opt. Lett. OSA, 42(19), pp. 3956–3959. doi: 10.1364/OL.42.003956.